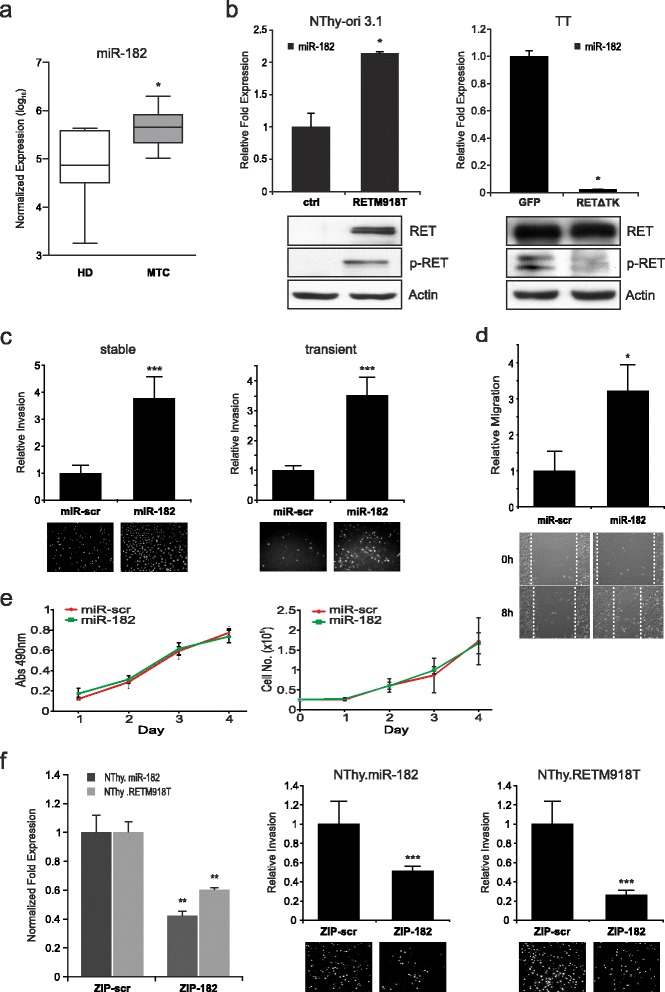
Fig. 1.

Identification of miR-182 in MTC and effect of miR-182 on cell migration and invasion in vitro. a TaqMan single assays for miR-182 expression in patient samples. Expression values are normalized to RNU6B and shown in log10 scale. Mann-Whitney test was used for statistical analyses. Values are means ± SD. HD healthy donor, MTC medullary thyroid carcinoma. b Analysis of miR-182 transcripts in NThy-ori 3.1 cells harboring the RETM918T mutation and TT cells transduced with Ad.RET∆TK (RET∆TK) and control Ad.GFP (GFP). For quantification values are normalized to RNU6B and the controls are set as one. Student’s t-test was used for statistical analysis. Presence of RET expression was confirmed in immunoblots using antibodies against phosphorylated RET (p-RET) and RET. Actin served as loading control. c Invasion of NThy-ori 3.1 cells with stable (left) and transient (right) expression of miR-182 or miR-scramble control (miR-scr). After 36 h migrated cells were DAPI stained and documented with fluorescence microscope. Fold changes of invasion were calculated relative to the control (set as 1). Representative images are shown from individual experiments for miR-scr and miR-182 below graphs. d Wound closure assays of NThy.miR-182 cells with representative images at 0 and 8 h after scratching (bottom). Bar graphs indicate quantitative data of three independent experiments after 8 h. Fold changes are relative to the controls. Values are means ± SD. e Proliferation and viability assays on NThy-ori 3.1 cells expressing miR-182 or miR-scr control. Specific amounts of cells were seeded and either counted every 24 h for 4 days (right) or treated with XTT for 1 h and absorbance was measured at 490 nm (left). Experiments were repeated three times and Student’s t-test was performed on quantification. f Inhibition of miR-182 through miRZIP-182 (ZIP-182) reduces migration. MiR-182 knockdown was analyzed by TaqMan qRT-PCR in stable NThy.miR-182 and NThy.RETM918T cell lines. MirZIP-scramble (ZIP-scr) was used as control. Relative expression levels were calculated with 2-∆∆Ct-method and normalized to RNU6B (left panel). Invading cells seeded on Matrigel coated transwell chambers were counted 24 h post transfection with miRZIP-182 or miRZIP-scramble (right panels). After 36 h migrated cells were DAPI stained and analyzed. Graphs show three individual experiments with representative images. Statistical significance is indicated as * p < 0.05, ** p < 0.01, *** p < 0.001
