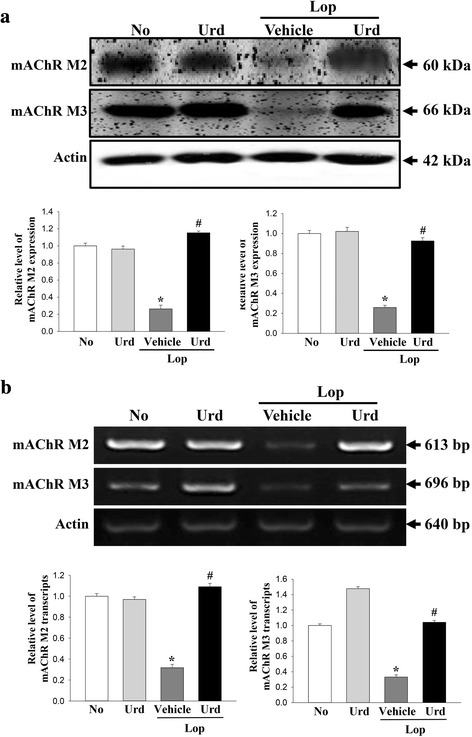
Fig. 3.

Expression of mAChRs transcript and protein in the transverse colon. a The expression of mAChR M2 and M3 proteins was measured by Western blot analysis using HRP-labeled anti-rabbit IgG antibody. b The levels of mAChR M2 and M3 transcripts in the total mRNA of transverse colons were measured by RT-PCR using specific primers. After the intensity of each band was determined using an imaging densitometer, the relative levels of mAChR M2 and M3 were calculated based on the intensity of actin. Five to six rats per group were assayed in triplicate by western blot and RT-PCR assays. Data represent the means ± SD of three replicates. *, p < 0.05 compared to the No treated group. #, p < 0.05 compared to the Lop + Vehicle treated group
