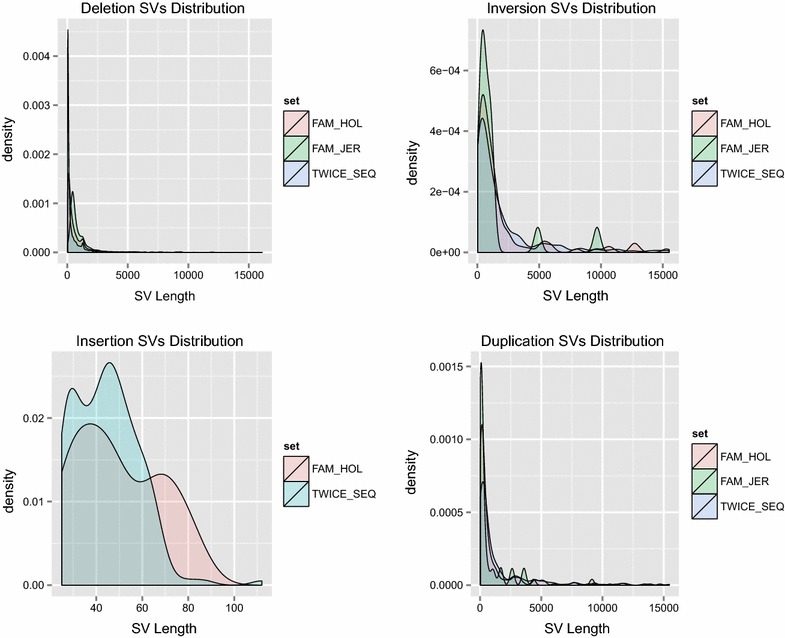
Fig. 2.

Size distribution of four types of structural variations in validation datasets (SV in twice-sequenced and Holstein and Jersey sire-son transmission sets). The x axis represents the length of SV; the y axis represents the frequency of SV for each length; the pink area represents the Holstein sire-son transmission validated set; the green area represents the Jersey sire-son transmission validated set; the blue area represents the twice-sequenced validated set
