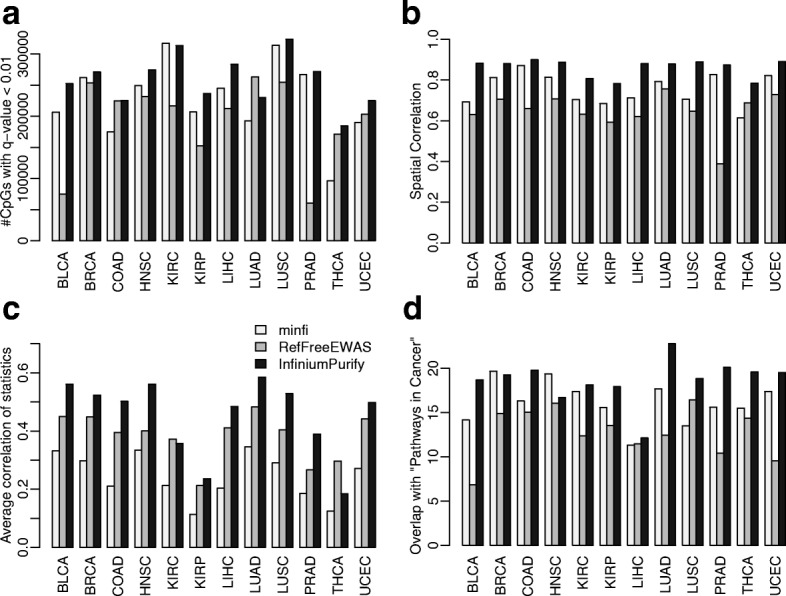
Fig. 4.

Differential methylation analysis results, with normal control. a Numbers of differential methylated CpG sites (FDR < 0.01). b Spatial correlations among test statistics from nearby CpG sites. c Average pan-cancer correlation of test statistics. d Enrichment p values for top 1000 differentially methylated genes within “PATHWAY-IN-CANCER” from KEGG
