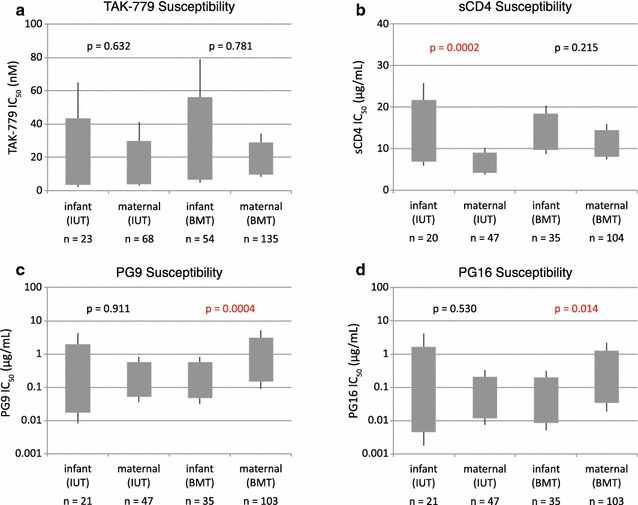
Fig. 5.

Phenotypic differences between variants transmitted in utero and through breast milk. Mean inhibitor IC50 values by subject and transmission mode were obtained through GEE calculations. The grey box indicates the 95% confidence interval and the whiskers indicate the 99% confidence interval. p values showing significant inhibitor IC50 differences for infant- and maternal-derived strains are indicated in red. Inhibitors tested were a TAK-779, b sCD4, c PG9, and d PG16. The number of envelope sequences tested for each group (n) is shown
