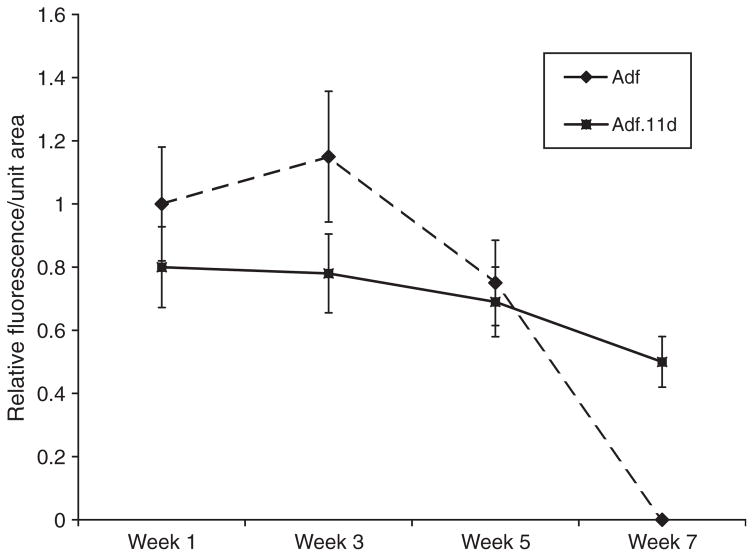
Figure 3.
Time course of GFP expression in macular organ cultures. Relative fluorescence intensity was determined by measuring total fluorescence/unit area for six utricles. The highest dose of vector (5×10⁶ pu) for each culture condition was used. The Adf (+) cultures at 1 week were used to normalize fluorescence levels. Advanced generation vectors that carried an E4 region deletion expressed GFP at a slightly lower level but yielded a longer expression period. Expression at the 3 and 7 week time points were significantly different (p < 0.01). n = 10 for each condition.

