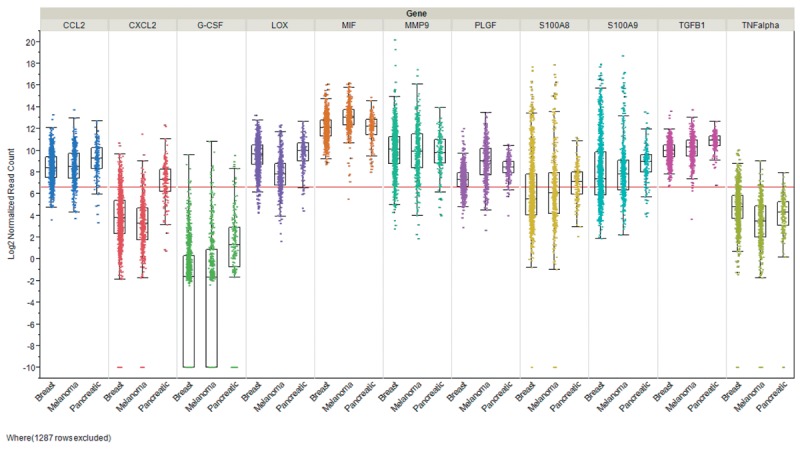
Figure 3. Expression of niche-related factors in breast cancer, melanoma and pancreatic tumors. Steady-state levels form RNA encoding the corresponding factors are shown. Three cohorts derived from The Cancer Genome Atlas (TCGA) are displayed: breast invasive carcinoma (n=1,100), melanoma (n=472) and pancreatic adenocarcinoma (n=179). Expression was quantitated by RNA sequencing and is shown as log2 normalized read counts. The red lines indicate low versus higher expression. Expression data are shown as box plots. The line in the middle of the box represents the data median, the rectangles show the upper and lower 25% quartile, therefore 50% of all data points are included in the rectangle. All other data points, except for outliers are located within the upper and lower whiskers. CCL2, CC chemokine ligand 2; CXCL2, chemokine (C-X-C motif) ligand 2; G-CSF, granulocyte stimulating factor; LOX, lysine oxidase; MIF, macrophage migration inhibitory factor; MMP9, macrophage migration inhibitory factor; TGFβ, transforming growth factor β1; TNFα, tumor necrosis factor α.

