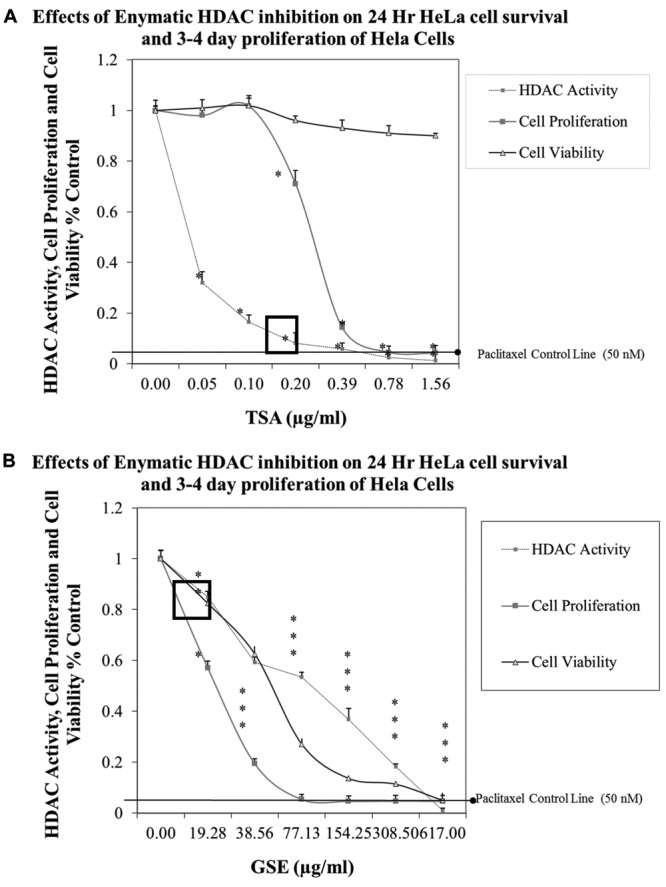
Figure 7. A. Correlation between TSA inhibition of Hela cell HDAC enzyme activity and 24 cell viability [0.5×10⁵ cells/ml] and 3-4 day cell proliferation [0.04×10⁵ cells/ml] vs. paclitaxel (50 nM) in HeLa cells. The data represent HDAC enzyme activity, cell viability and proliferation as % controls, and are presented as the mean±S.E.M, n=4. Differences between control and TSA-treated samples were analyzed by a one-way ANOVA, followed by a Tukey post hoc test. *p<.05. B. Evaluation of GSE on 24-h cell viability [0.5×10⁵ cells/ml] and 3-4 day cell proliferation [T0=0.04×10⁵ cells/ml]. The data represent HDAC enzyme activity, cell viability and proliferation as % controls, and are presented as the mean±S.E.M, n=4. Differences between control and GSE treated samples were analyzed by a one-way ANOVA, followed by a Tukey post hoc test. *p<0.05.

