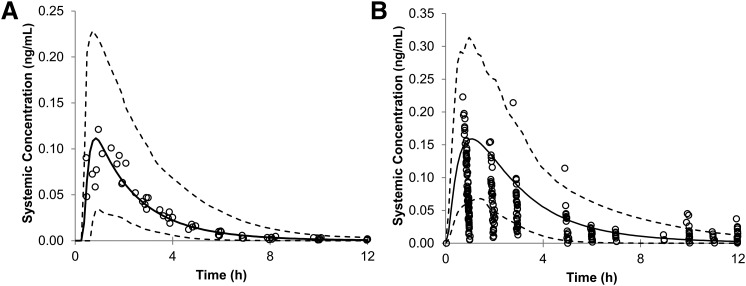
Fig. 6.
Mean predicted systemic concentration of oseltamivir (black line) in adults after 150-mg oral administration (A) and in infants after 3 mg/kg oral administration (B) with the predicted 5th and 95th percentile CIs (dotted lines) plotted. The circles represent the observed in vivo values from the literature. The observed in vivo values were inside the predicted 5th to 95th percentile interval for adults. Some of the observed pediatric values are below the 5th percentile and above the 95th percentile of the predicted values.

