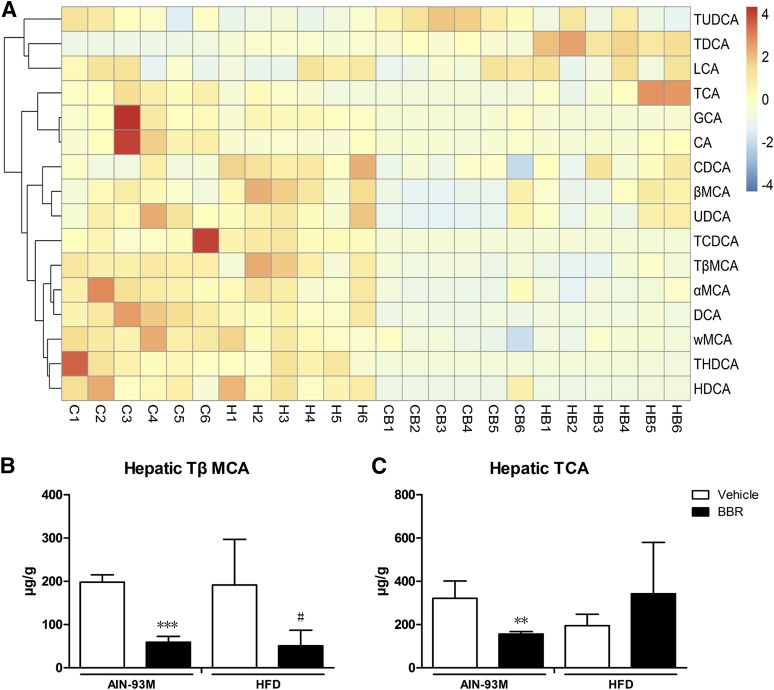
Fig. 4.
Changes in bile acid composition in the liver after BBR treatment. Bile acids in liver of male WT mice after treatment with BBR (150 mg/kg, i.g.) or vehicle (CMC-Na) for 8 weeks were measured using LC-MS/MS. (A) Heatmap detailing the bile acid composition of liver. The color key represents the calibrated contents of bile acids, and the dendrogram on the left showed the clustering of bile acids with the similar changes. (B) TβMCA levels in the liver. (C) TCA levels in the liver. Error bars show S.D. of replicates (n = 6). **P < 0.01, ***P < 0.001, compared with normal control group; #P < 0.05, compared with high-fat control group.

