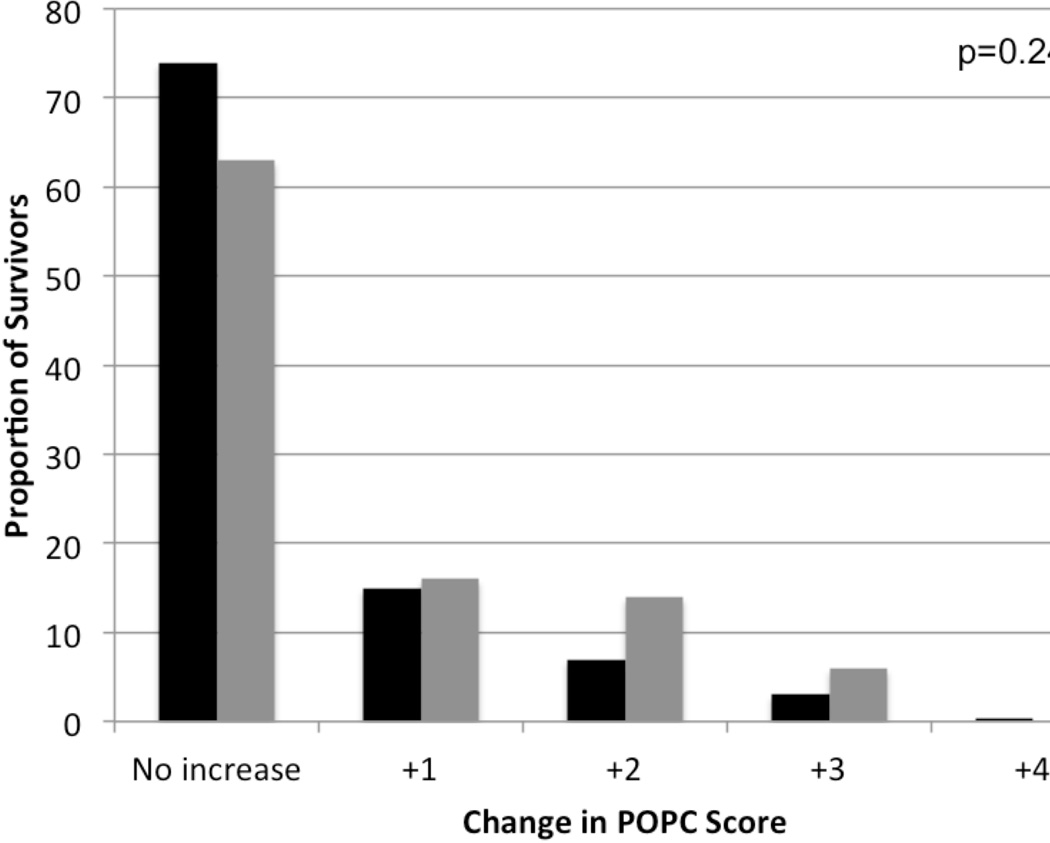
Figure 1.
Change in POPC scores from baseline to discharge. Bars represent the proportion of survivors who had increases (worsening) in pediatric overall performance category (POPC) scores from baseline to hospital discharge. The x-axis shows the number of categories of increase in score. Black bars represent patients with No/mild acute kidney injury (AKI) and gray bars represent patients with Severe AKI.

