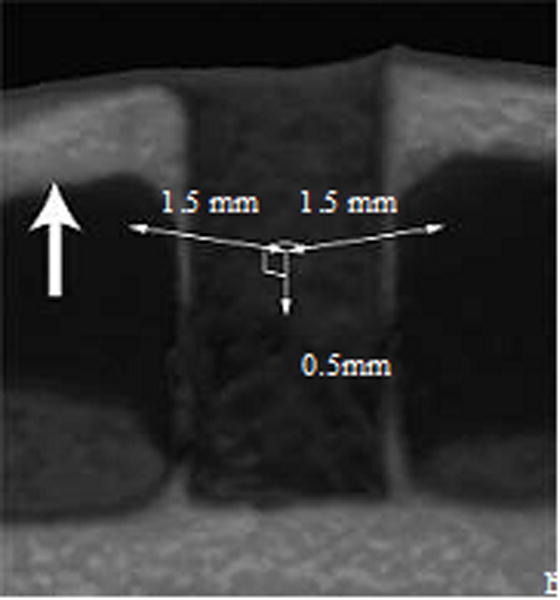
Figure 1.

Scanning image of the peri-implant bone for BV/TV, BS/BV, TbTh, Vtr and TbN analyses. A 1.5-mm2 area surrounding the bone socket where a 1.2-mm implant had been placed was three-dimensionally scanned from a depth of 0.5-mm to 1.0-mm from the inner cortical bone, resulting in a 1.5 × 1.5 × 0.5-mm volume of bone scanned.
