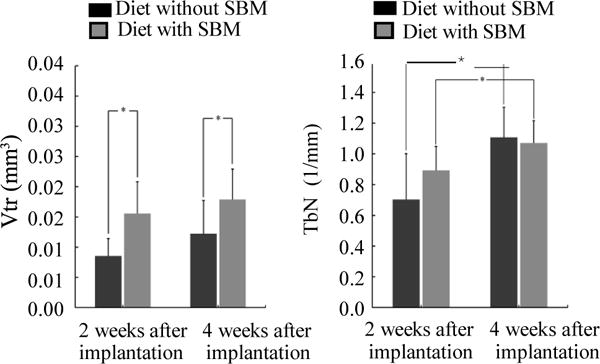
Figure 4. Between- and within-group comparisons of Vtr and TbN.

Results of Vtr(A): Vtr was significantly greater in the rats were fed SBM than in those were not fed SBM at 2 and 4 weeks after implantation (P < 0.05). There were no significant increases in Vtr from 2 to 4 weeks after implantation in either of the groups (P > 0.05). Results of TbN (B): TbN was not significantly greater in the rats were fed SBM than in those were not fed SBM at 2 and 4 weeks after implantation (P > 0.05). TbN also significantly increased between 2 and 4 weeks after implantation in both groups (P < 0.05).
