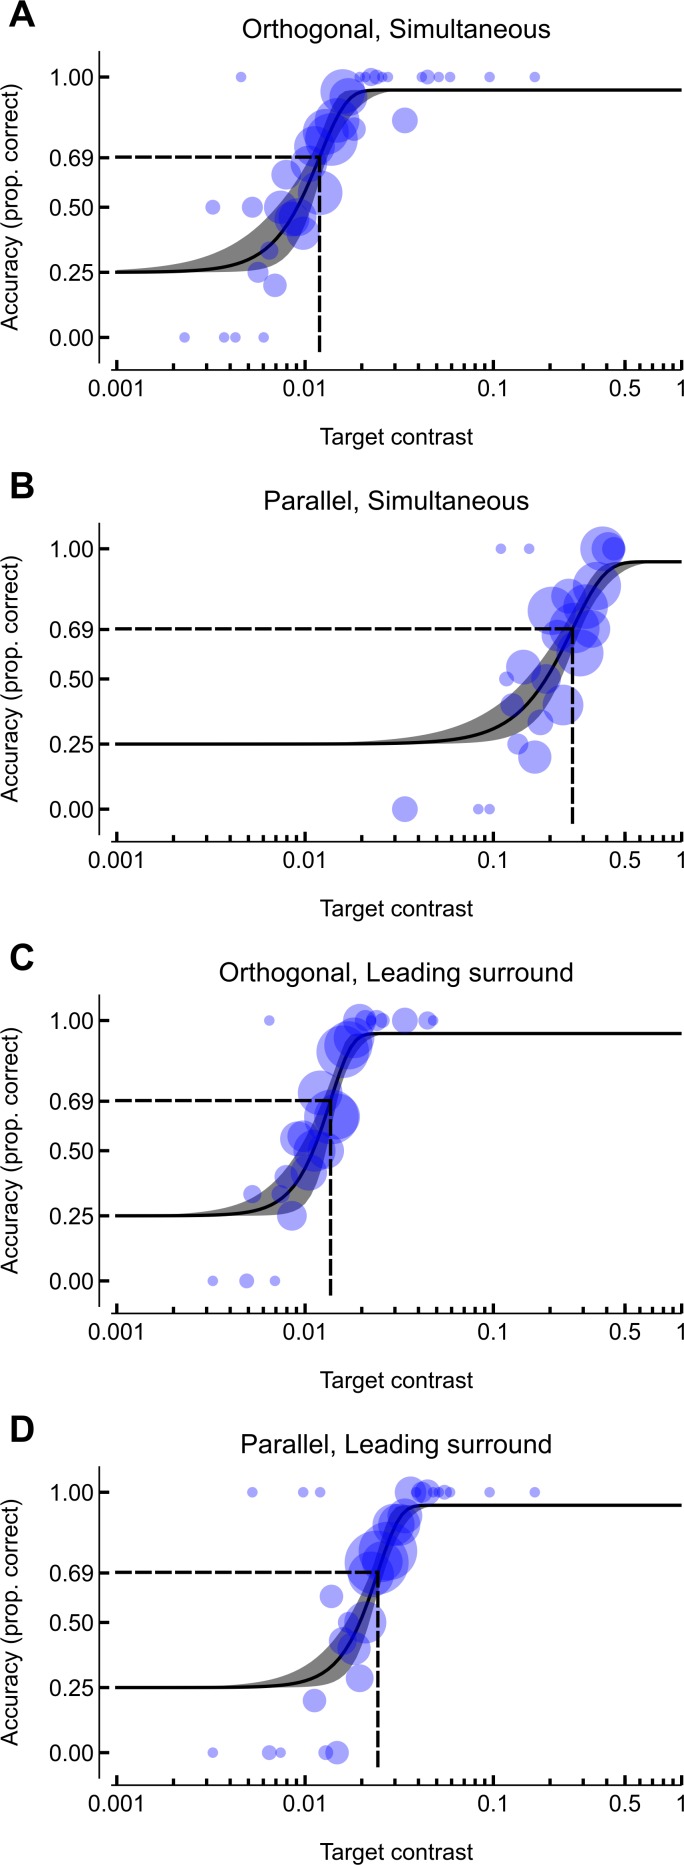
Figure 2. Data and psychometric functions for a representative participant.
Circles represent the proportion of correct responses within a given target contrast bin, with an area that is proportional to the number of trials at that contrast. Solid black lines depict the psychometric function, with the grey surrounding region capturing the 95% CI. The dashed lines indicate the contrast detection threshold (the target contrast corresponding to 69.25% accuracy). Vertical axes are accuracy (proportion correct) and the horizontal axes are the target contrast (logarithmic spacing).

