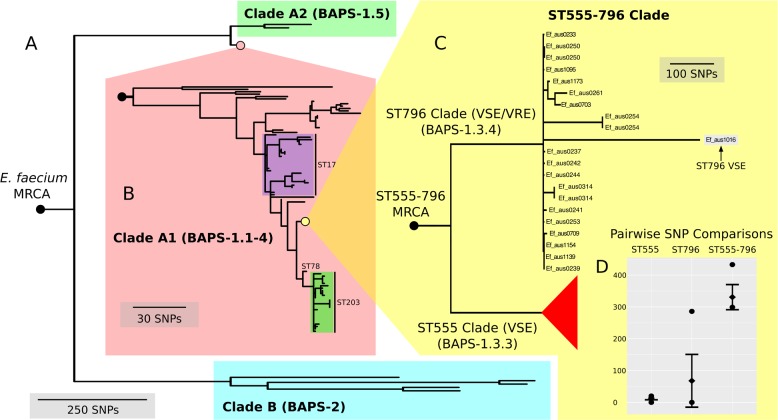
Figure 3. Nested core genome SNP phylogeny of the greater E. faecium population.
(A) E. faecium population tree containing the major division between the community and hospital associated clades (B and A). (B) Nested tree focusing on the A1 clade containing the hospital associated isolates. (C) Nested tree focusing on the ST555-796 containing clade. Nodes with less than 70% bootstrap support have been collapsed. The VSE ST796 isolate is located within the ST796 clade. (D) Pairwise core SNP comparisons of within and between group diversity for the ST555 and ST796 clades (ST555: 13 SNPs, ST796: 68 SNPs, ST555-796: 330 SNPs). Y-axis depicts the number of SNP differences, error bars indicate one standard deviation above and below the mean and points represent the minimum and maximum values.

