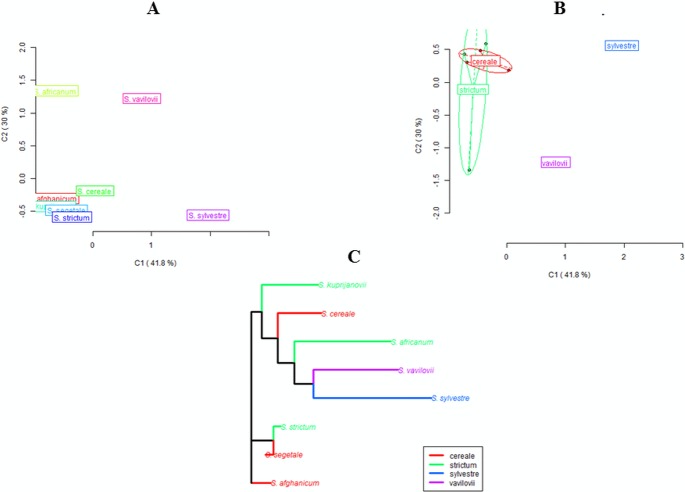
Figure 2. Principal Coordinate Analyses for epigenetic differentiation between the groups and Neighbor-Joining tree for epigenetic distances.
Principal Coordinate Analyses (PCoA) for epigenetic (MSL) differentiation between Secale taxons (A) and Secale species (B); (C): Neighbor-Joining tree of Secale species for epigenetic (MSL) distances; colors represent different taxons/species; (A), (B): C1 and C2 coordinates are shown with the percentage of variance explained by them, in (B) different point types represent subspecies from different species, species labels show the centroid for the points cloud in each species, ellipses represent the average dispersion of those points around their center, the long axis of the ellipse shows the direction of maximum dispersion and the short axis, the direction of minimum dispersion; cereale: S. cereale, S. c. ssp. afghanicum, S. c. ssp. segetale; strictum: S. strictum, S. s.ssp. africanum, S. s. ssp. kuprijanovii; sylvestre: S. sylvestre; vavilovii: S. vavilovii.

