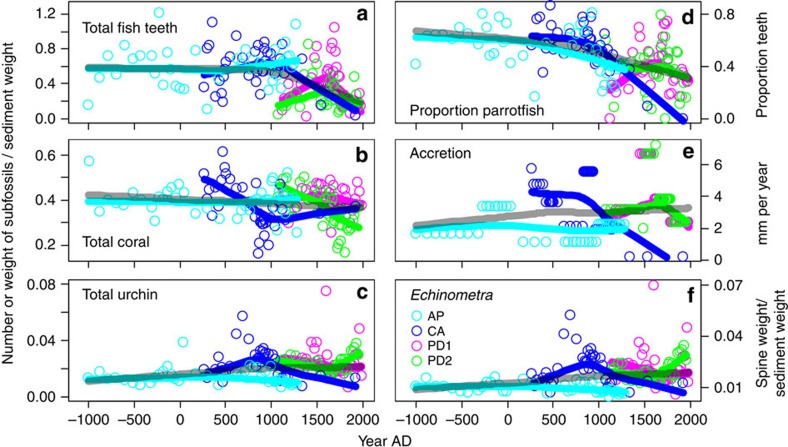
Figure 3. Millennial-scale trends in abundance of major reef subfossil groups and accretion rates.
(a) Total fish tooth abundance measured as number of individual teeth divided by dry weight of all sediment size fractions combined. (b) Total coral abundance measured as weight of coral fragments from>2 mm sediment fraction divided by dry weight of>2 mm fraction. (c) Total urchin abundance measured as weight of urchin spines divided by dry weight of 0.5–2 mm sediment fraction. (d) Proportion of all teeth belonging to parrotfish. (e) Reef accretion rate represented as mm of reef sediment accumulated per year. (f) Abundance of Echinometra urchins measured as total spine weight of genus divided by dry weight of 0.5–2 mm sediment fraction. Number samples=154. Turquoise=Airport Point, blue=Cayo Adriana, pink and green=Punta Donato 1 and 2, respectively. Coloured lines are loess smoothed estimated trends for individual cores and semitransparent black lines are loess smoothed estimates for all cores combined; smoothing parameter=0.9.

