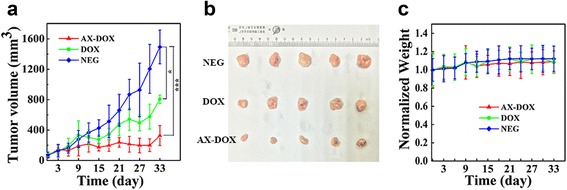
Fig. 5.

In vivo evaluation of the antitumor efficacy of micelles. a Tumor growth curves for the different DOX formulations with a dosage of 5 mg/kg and a total of three treatments. All values are presented as a mean SD (n = 5); *p < 0.05; **p < 0.01; ***p < 0.001; NS not significant. b Images of the tumors collected after sacrificing the mice on day 33. When tumors were established and reached ~50 mm3, mice were treated with the various drug formulations. The tumor volume (V) was calculated as: , where L is long diameter and W is short diameter of tumor determined using a caliper. c Change in the body weight of animals as a function of time
