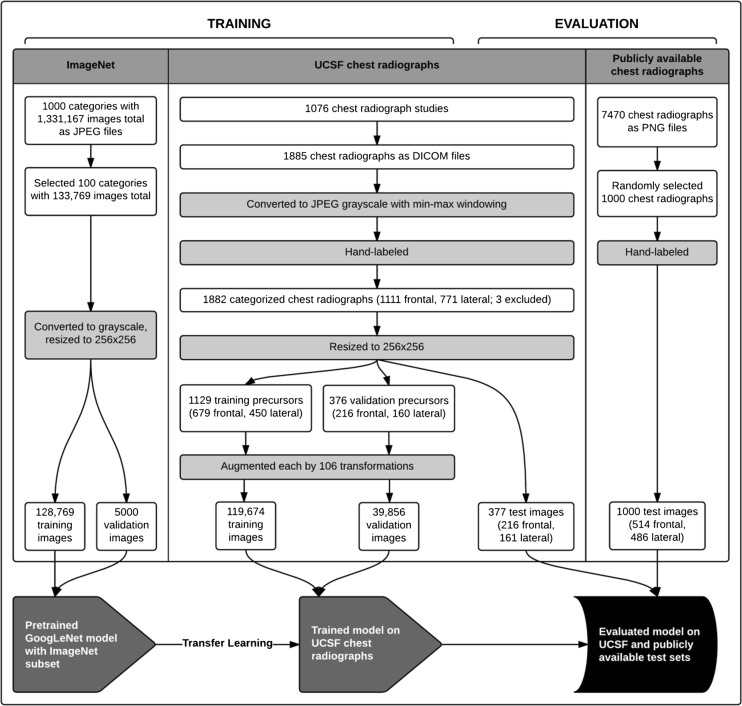
Fig. 1.
Methodology and data flow of image preparation and model creation. The flowchart outlines the pathway of image collection, selection, processing, and manual labeling (for the chest radiographs) for each image source; division of prepared images into test, training, and validation sets; and training and evaluation of the GoogLeNet model using image sets from sources as indicated in each step. White rectangular boxes indicate numbers of images at collection, selection, division, and post-processing steps, as well as numbers of categories (for ImageNet) and studies (for the UCSF chest radiographs) in which the images were contained. Image processing and labeling steps are in grey rectangular boxes

