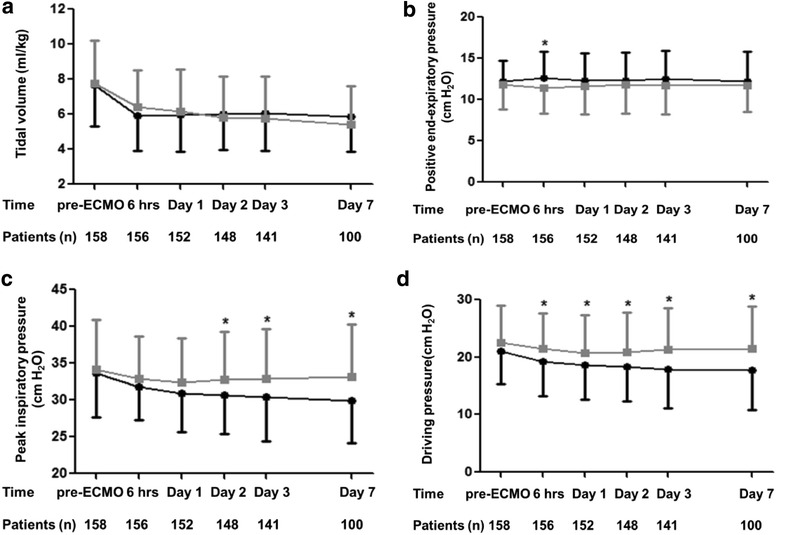
Fig. 2.

Serial changes in a tidal volume, b positive end-expiratory pressure (PEEP), c peak inspiratory pressure and d dynamic driving pressure before and after extracorporeal membrane oxygenation (ECMO). Error bars represent the mean ± standard error. Dark line denotes survivors and gray line denotes nonsurvivors. *A value of p less than 0.05 compared between survivors and nonsurvivors
