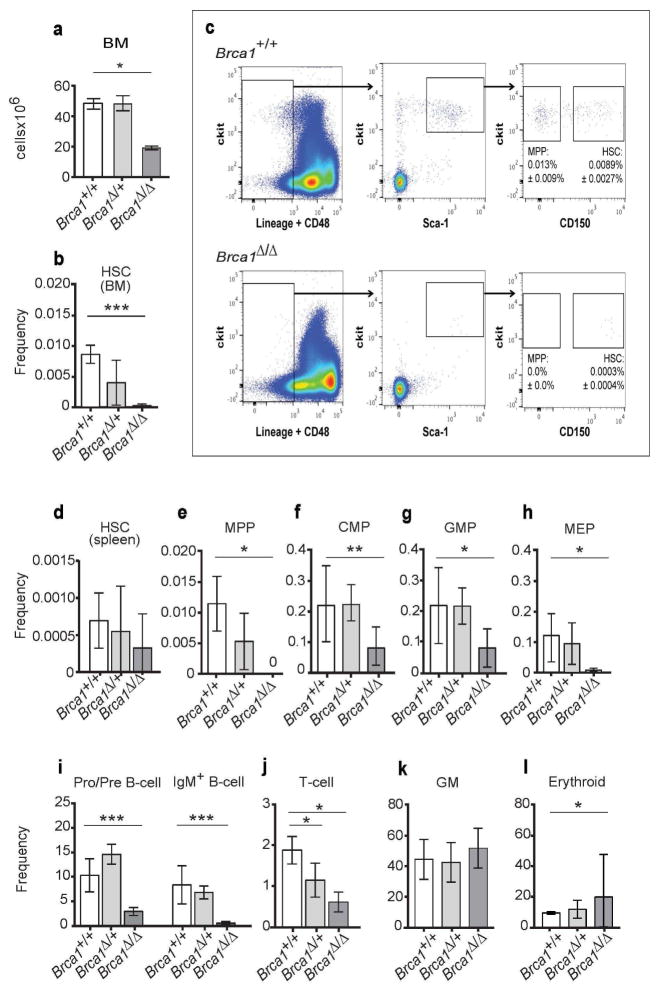
Figure 3. Brca1 deficiency causes HSC depletion.
(A) Bone marrow (BM) cellularity (1 femur and 1 tibia) of control (+/+; n=4), Vav1-iCre;Brca1F22-24/+ (Δ/+; n=5), and Vav1-iCre;Brca1F22-24/F22-24 mice (Δ/Δ; n=4). (B) Frequency (number of HSCs/total BM cells) of HSCs in the BM of control (+/+; n=7; white bar), Vav1-iCre;Brca1F22-24/+(Δ/+; n=5; light grey bar), and Vav1-iCre;Brca1F22-24/F22-24 mice (Δ/Δ; n=4; dark grey bar). (C) Representative flow cytometry plot showing CD150+CD48−LSK HSCs in wild type mice (+/+; top panel) and Vav1-iCre;Brca1F22-24/F22-24 mice (Δ/Δ; bottom panel). Frequency of (D) HSCs in the spleen of control (n=3), Vav1-iCre;Brca1F22-24/+ (n=3), and Vav1-iCre;Brca1F22-24/F22-24 mice (n=3). Frequency of (E) MPPs, (F) CMPs, (G) GMPs, (H) MEPs, (I) B lineage cells, (J) T lineage cells, (K) myeloid cells, and (L) erythroid cells in the bone marrow of control (+/+; n=7; white bar), Vav1-iCre;Brca1F22-24/+(Δ/+; n=5; light grey bar), and Vav1-iCre;Brca1F22-24/F22-24 mice (Δ/Δ; n=4; dark grey bar). Statistical significance was assessed using a two-tailed Student’s t-test (*P<0.05, **P<0.01, ***P<0.001).

