Figure 2.

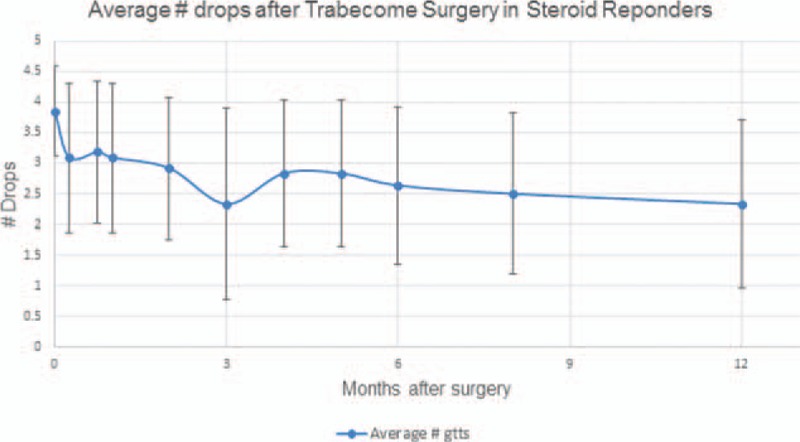
Mean number of medications throughout study. A graphical representation of mean number of medications from sample size during length of study.

Mean number of medications throughout study. A graphical representation of mean number of medications from sample size during length of study.