Figure 3.

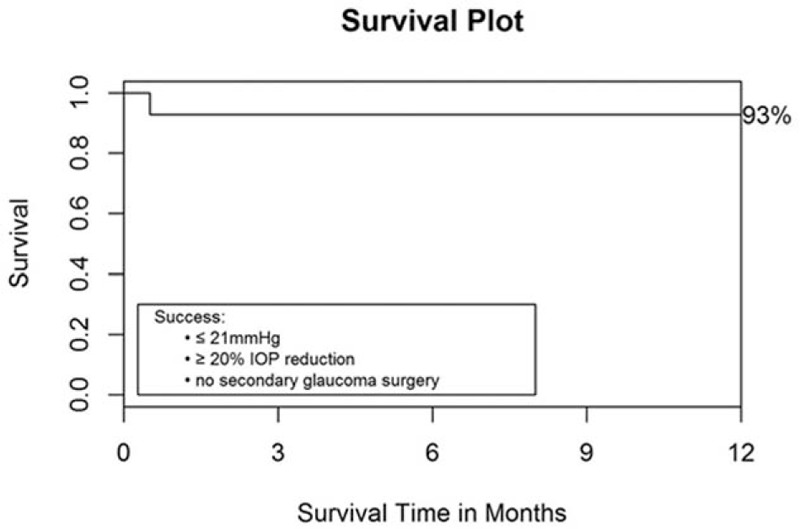
Kaplan–Meier survival curve for 1-year follow-up. Survival analysis plot with time point of failure; legend includes the criteria used to define success in this study.

Kaplan–Meier survival curve for 1-year follow-up. Survival analysis plot with time point of failure; legend includes the criteria used to define success in this study.