
Figure 6.
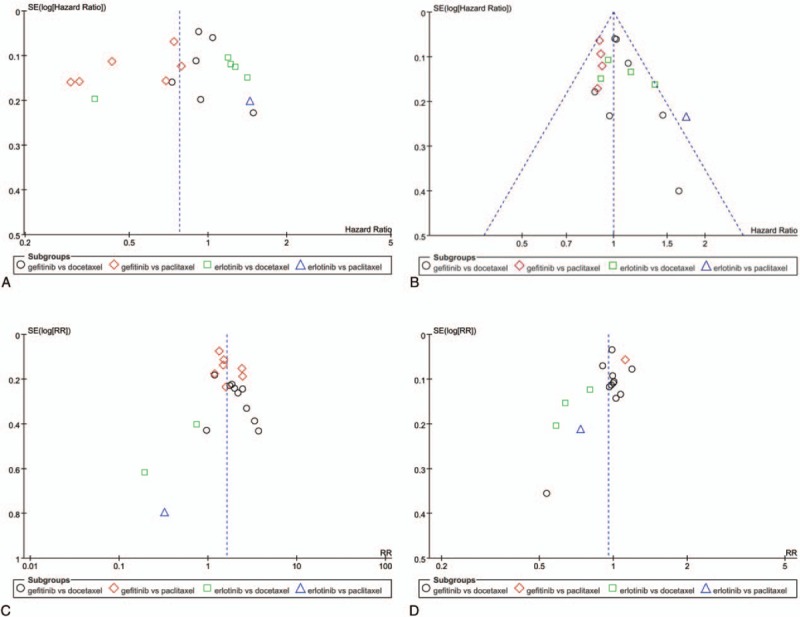
Funnel plot of comparison for PFS (A), OS (B), objective response rate (C), and disease control rate (D) between gefitinib and taxanes in NSCLC. NSCLC = nonsmall-cell lung cancer, OS = overall survival, PFS = progression-free survival.
Official websites use .gov
A
.gov website belongs to an official
government organization in the United States.
Secure .gov websites use HTTPS
A lock (
) or https:// means you've safely
connected to the .gov website. Share sensitive
information only on official, secure websites.
Funnel plot of comparison for PFS (A), OS (B), objective response rate (C), and disease control rate (D) between gefitinib and taxanes in NSCLC. NSCLC = nonsmall-cell lung cancer, OS = overall survival, PFS = progression-free survival.