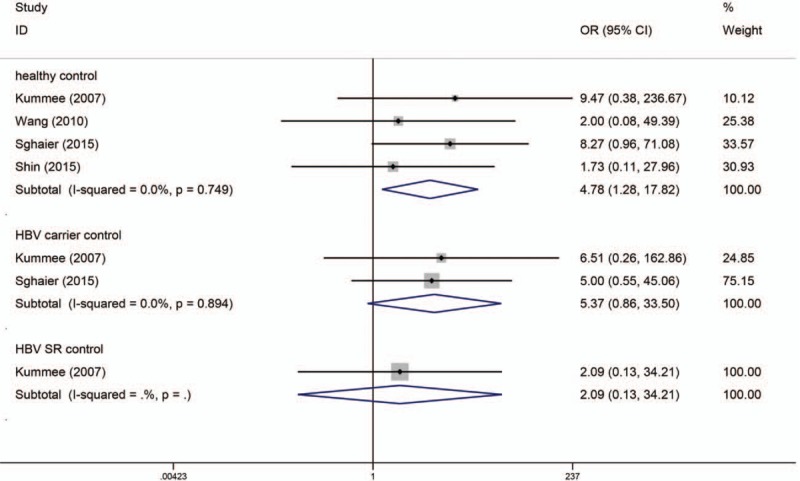
Figure 4.

Codominant model (AA vs GG) of TNF-α G238A polymorphism on risk of HBV-HCC. The association was indicated as odds ratio (OR) estimate with the corresponding 95% confidence interval. The OR estimate of each study is marked with a solid black square. The size of the square represents the weight that the corresponding study exerts in the meta-analysis. The confidence intervals of pooled estimates are displayed as a horizontal line through the diamond. OR more than 1 indicates increased risk of HBV-HCC.
