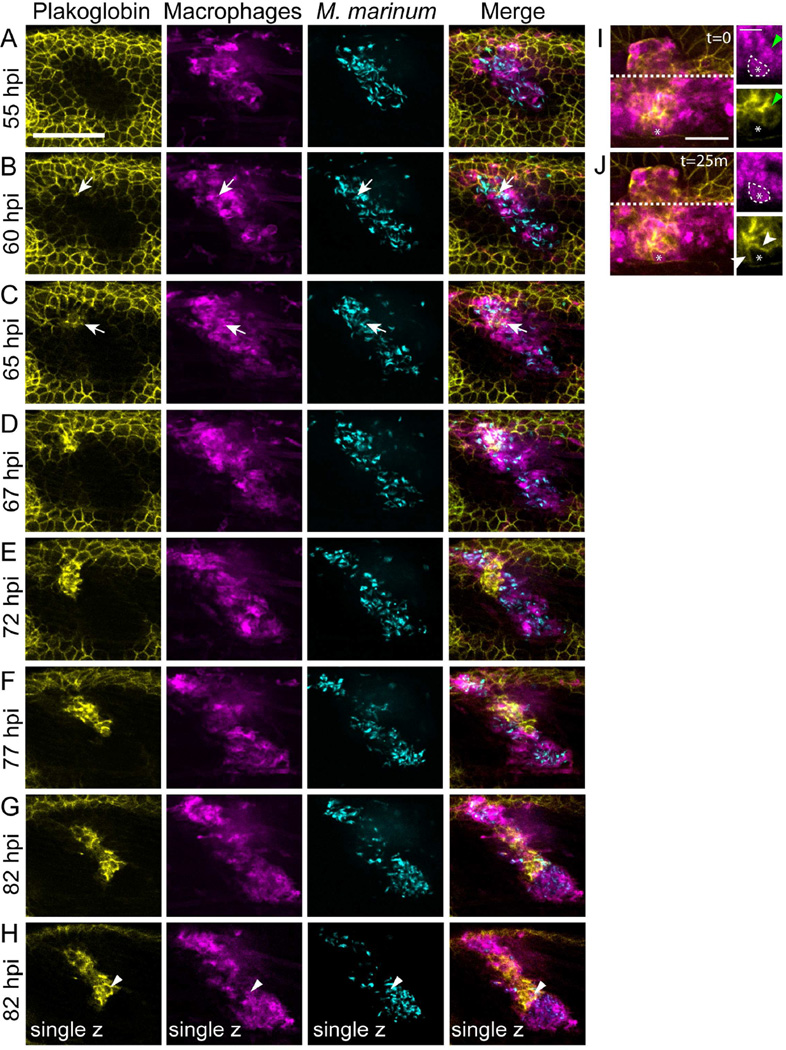
Figure 2. Live Imaging of Adherens Junction Formation within Macrophages of the Developing Granuloma.
Tg(mfap4:tomato-caax); Gt(jup-citrine)ct520a animals were infected with 150–250 FB/fish and imaged from 48 hours post infection (hpi) to 96 hpi to visualize adherens junction formation during granuloma formation. (A–G) The image in each panel is a maximum projection of a 28 µm z-stack. Arrows indicate the site of initial adherens junction formation within the granuloma. Scale bar – 100 µm. (H) single z-plane image from 82 hpi timepoint demonstrating plakoglobin adherens junction formation within granuloma macrophages. Arrowheads indicate a plakoglobin-positive infected macrophage in single plane image. Gamma adjustments were applied uniformly across all images to facilitate display. Note – the initial plakoglobin signal surrounding the granuloma is the larval skin within the imaging planes. (I) and (J) Images of a granuloma in another Tg(mfap4:tomato-caax); Gt(jup-citrine)ct520a animal demonstrating formation of adherens junctions (plakoglobin, yellow) between adjacent macrophages (magenta). (I) A plakoglobin-negative approaching macrophage (white dotted line, asterisk) contacts a plakoglobin-positive macrophage (green arrowheads). (J) 25 minutes later, the macrophage relocalizes plakoglobin to the cell surface (white arrowheads). Scale bar – 100 µm in main image, 50 µm in inset. See also Movies S1 and S2.

