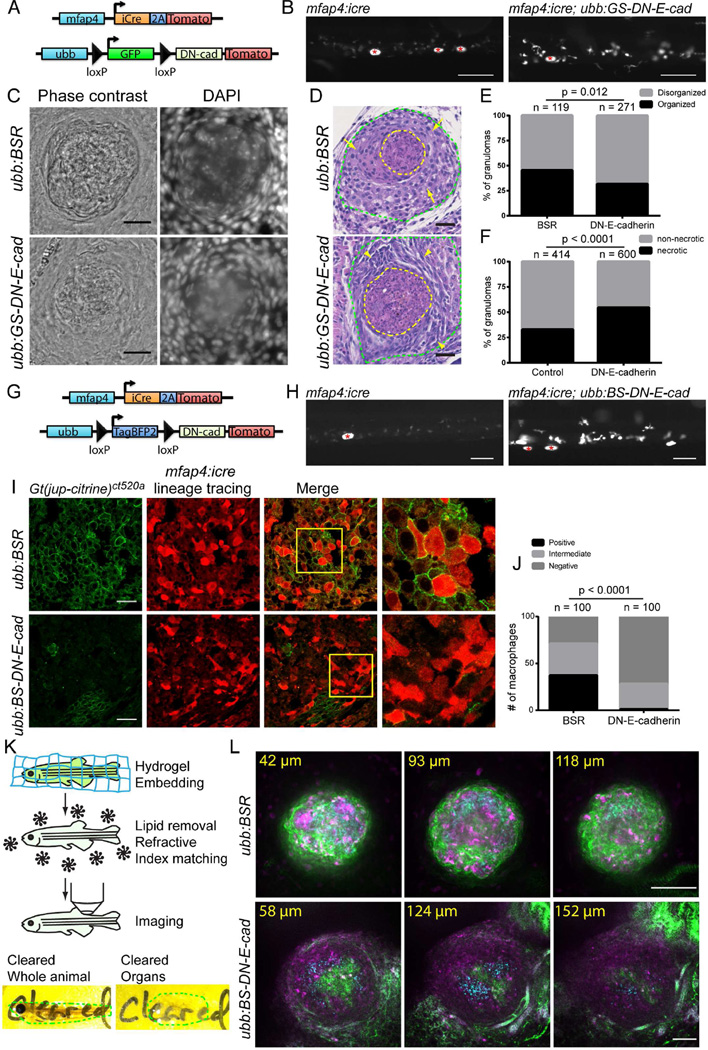
Figure 5. Cadherin-dependent Adherens Junctions Promote Granuloma Organization.
(A) Schematic of lineage tracing approach used to drive DN-E-cadherin within macrophages. (B) Images of tomato expression in Tg(mfap4:icre) and Tg(mfap4:icre; ubb:GS-DN-e-cadherin) animals showing increased tomato expression in Tg(mfap4:icre; ubb:GS-DN-e-cadherin) animals relative to Tg(mfap4:icre) animals, indicative of rearrangement of the lineage tracing DN-E-cadherin cassette. Asterisks mark autofluorescent melanophores. Scale bar – 100 µm. (C) Images of 2 wpi M. marinum granulomas in Tg(mfap4:icre; ubb:BSR); Gt(jup-citrine)ct520a and Tg(mfap4:icre; ubb:GS-DN-e-cadherin) fish showing the morphology of granulomas by phase contrast and DAPI staining of granuloma nuclei. Animals were infected with 400 FB/fish M. marinum. Scale bar – 25 µm. (D) H&E stained sections from Tg(mfap4:icre; ubb:BSR); Gt(jup-citrine)ct520a and Tg(mfap4:icre; ubb:GS-DN-e-cadherin) demonstrating morphological alterations in DN-E-cadherin expressing animals. Sections from 2 wpi animals infected with 400 FB/fish M. marinum. Yellow dotted lines denote necrotic cores of individual granulomas. Green lines indicate regions of macrophages surrounding the necrotic core. Arrows indicate cells with classical epithelioid morphology within Tg(mfap4:icre; ubb:BSR) animals. Arrowheads mark groups of epithelioid macrophages with spindle morphology. Scale bars – 25 µM. (E–F) Quantitation of necrotic granulomas in pooled Tg(mfap4:icre; ubb:BSR); Gt(jup-citrine)ct520a and DN-E-cadherin expressing animals (mfap4:icre; ubb:GS-DN-e-cadherin and mfap4:icre; ubb:BS-DN-e-cadherin) from 3 experiments. (E) Organization of cells surrounding the necrotic core, visualized by brightfield as outlined in Figure S4D. P value determined by Fisher’s exact test and (F) The percentage of necrotic granulomas in each fish. Populations compared by Fisher’s exact test. (G) Schematic of lineage tracing approach used to drive rearrangement of the Tg(ubb:BS-DN-e-cadherin) construct leading to DN-E-cadherin expression in macrophages. (H) Images of Tg(mfap4:icre) and Tg(mfap4:icre; ubb:BS-DN-e-cadherin) animals demonstrating expression of DN-E-cadherin in macrophages through increased tomato fluorescence from the downstream 2A tomato cassette. Asterisks mark autofluorescent melanocytes. Scale bar – 100 µm. (I) Images of macrophage localization (red, mfap4:icre lineage tracing) and plakoglobin positive adherens junctions (green, Gt(jup-citrine)ct520a) of granulomas formed in control Tg(mfap4:icre; ubb:BSR); Gt(jup-citrine)ct520a and Tg(mfap4:icre; ubb:BS-DN-e-cadherin); Gt(jup-citrine)ct520a) animals. Boxes indicate regions of the merged image magnified in the images to the right. Scale bar – 25 µm. (J) Quantitation of plakoglobin expression within macrophages in non-necrotic granulomas from either control Tg(mfap4:icre; ubb:BSR); Gt(jup-citrine)ct520a or DN-E-cadherin expressing macrophages from Tg(mfap4:icre; ubb:BS-DN-e-cadherin); Gt(jup-citrine)ct520a animals. Macrophages were scored for plakoglobin positivity as outlined in experimental procedures. Quantitation from 5 granulomas in 2 animals each. Populations were compared by Chi square test. (K) Top - Cartoon of the steps of CLARITY-mediated tissue clearing in zebrafish. Bottom - images of cleared intact zebrafish and zebrafish organs. Dotted lines indicate the extent of the individual tissues. (L) Imaging of intact, CLARITY cleared granulomas in Tg(mfap4:icre; ubb:BSR); Gt(jup-citrine)ct520a and Tg(mfap4:icre; ubb:BS-DN-e-cadherin); Gt(jup-citrine)ct520a animals demonstrating loss of adherens junctions and organization in DN-E-cadherin animals. Green – plakoglobin, magenta – macrophages, M. marinum – cyan. Micron distances indicate the depth of each individual image relative to the top of the granuloma. Scale bar – 100 µm. For CLARITY images, gamma adjustment was performed uniformly for display. See also Figures S4 and S5 and Movies S3–S5.

