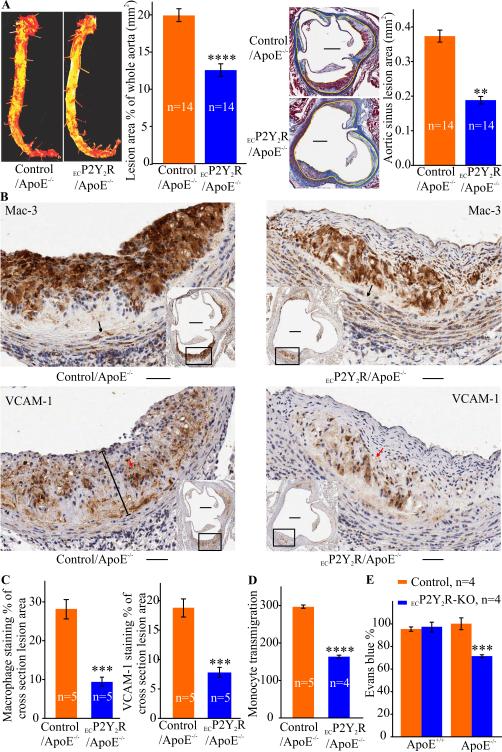
Figure 3.
Endothelial cell-specific deletion of P2Y2R reduces atherosclerosis, inflammation and endothelial barrier dysfunction in ApoE−/− mice. A, Analysis of atherosclerotic lesions in ECP2Y2R ApoE−/− and control ApoE−/− mice fed standard chow diet for 25 weeks. Left panel shows representative photomicrographs of Oil red O-stained aortas collected between the subclavian and iliac branches and quantitative computer- assisted image analysis of lipid deposition in the entire aorta. Data represent the percentage surface area of the aorta occupied by atherosclerotic lesions in control (n=14) and ECP2Y2R/ApoE−/− mice (n=14). ****p<0.0001. Right panel shows representative images of cross sections of aortic sinus from ECP2Y2R/ApoE−/− and control/ApoE−/− mice stained with Masson's trichrome. Scale bar represents 250 μm. The adjacent graphs shows the mean ±SEM lesion area measured in 5 sections for each of 14 animals. The lesion area in the aortic sinus was determined by computer-assisted image analysis. The yellow lines delineate the lesions. **p < 0.01. B, Representative images of immunohistological staining of atherosclerotic lesions in the aortic sinus stained with the anti-macrophage Mac-3 antibody or VCAM-1 as indicated. Scale bar represents 50 μm and the scale bar in inset represents 250 μm. Morphometric analysis of the stained areas are indicated in panel C. Data are the mean ±SEM of the percentage staining of the total plaque area in 5 consecutive sections in 5 mice for each genotype. ***p<0.001. D, Monocyte transmigration across endothelial cell monolayers from control and ECP2Y2R-KO mice. EC were grown on transwell membrane with monocytes from wild-type added to the top chamber and MCP-1 to the bottom. Transmigrated monocytes were counted and normalized to the non-treated condition (without MCP-1). ****p< 0.0001. E, Mice were injected with Evans blue dye and leakage of the dye into the aortas was quantified after extracting the dye and measuring absorbance at 620 nm. Values were normalized to the dry weight of the aorta. Data represent mean ±SEM; (n= 5). ***p < 0.001.

