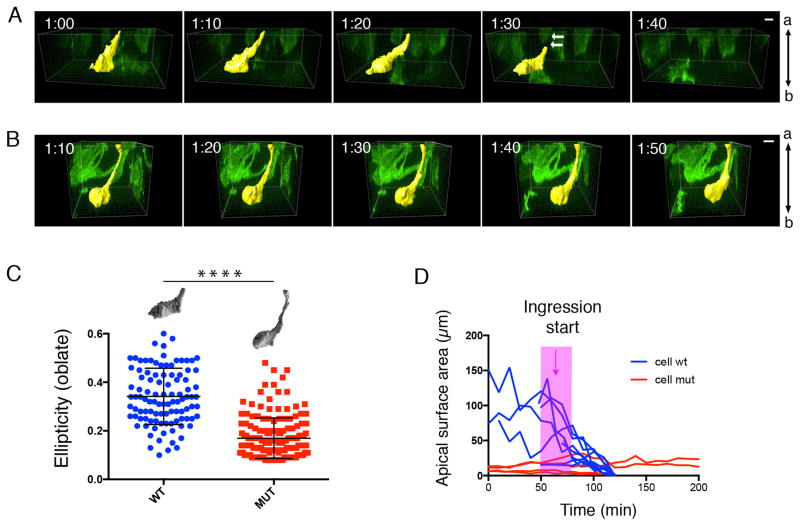
Figure 3. Live imaging defines defects in cell ingression in Crumbs2 mutants.
Individual cells delaminating at the primitive streak (highlighted yellow) in snapshots from time-lapse imaging of wild-type (A) and Crumbs2 (B) mutant embryos with mosaically labeled cells using the mT/mG system. Apical is up in these transverse optical sections. In wild-type embryos (A), the cell constricts its apical membrane and detaches its apical connection to delaminate from the epithelium in less than 2 hours (arrows showing loss of apical connection/retraction tail). In Crumbs2 mutants (B), the cell constricts its apical membrane and sends out basal protrusions but fails to leave the epithelium. Time interval: 10 minutes. Apical side of the epithelium is up. (C) Quantitative analysis of cell shape at the streak in wild-type and Crumbs2 mutant embryos. Membrane GFP-expressing cells were depicted manually for cell surface rendering and ellipticity was plotted for wild-type and Crumbs2 mutant streak cells to compare cell shape. Wild-type cells at the streak were predominantly oblate ellipsoids (flattened spheroids); long axes parallel to the epiblast surface (e = 0.34 ± 0.01 (mean ± SEM), n=102 structures from 9 cells, 4 independent experiments), whereas mutant cells were prolate ellipsoids (cigar-shaped) with long axes perpendicular to the epiblast surface (e = 0.17 ± 0.01 (mean ± SEM), n=169 structures from 13 cells, 3 independent experiments) (unpaired t-test: p < 0.0001). (D) Ingression dynamics of streak cells. The apical surface area was determined from optical confocal sections of GFP-labeled cells from time-lapse images at the apical surface of streak cells. The apical surface of wild-type cells reduced over time, whereas the mutant cells stuck at the streak have a constant small apical surface area. Pink bar marks the onset of ingression in wild type. Scale bars A, B,10 μm.

