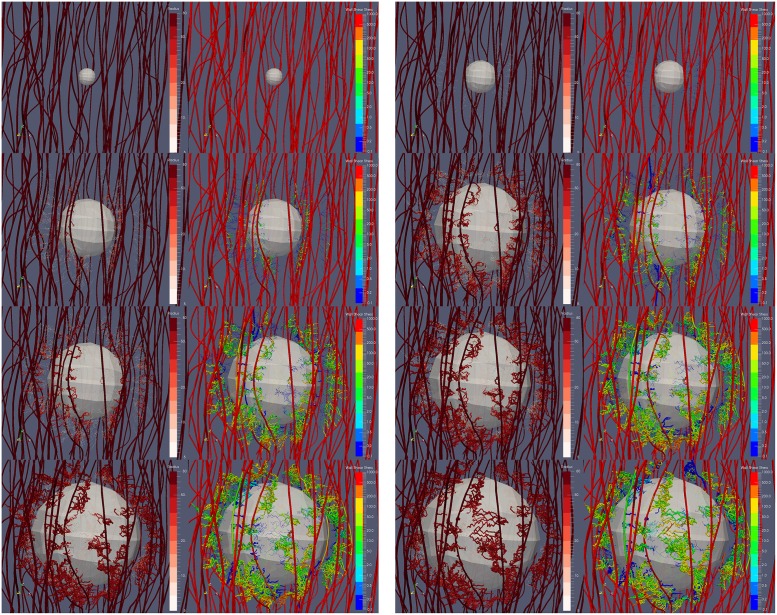
Fig 9. Snapshots of the tumour growth and angiogenesis simulation illustrating the remodelling of the microvasculature and haemodynamics.
Visualisation of the developing tumour and the formation of new vascular sprouts, branches and anastomoses over a period of 40 days (from top to bottom and from left to right: day-0, day-5, day-10, day-15, day-20, day-25, day-30 and day-40). In the contour maps, the vascular lumen radius range is 5–80 μm and the wall shear stress magnitude range is 10−1—103 mm-Hg (on logarithmic scale).

