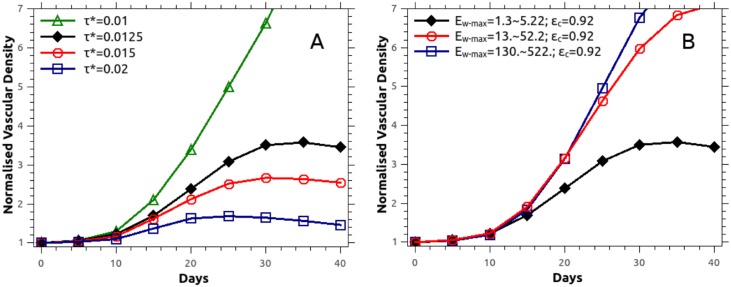
Fig 12. Predictions of the normalised vascular density as a function of time.
Increase of tumour vascular network density with respect to time when varying: A: the TAF angiogenesis threshold τ*, and B: the capillary wall stiffness, Ew-max. See also description in Fig 7 for the definition of the normalised vascular density.

