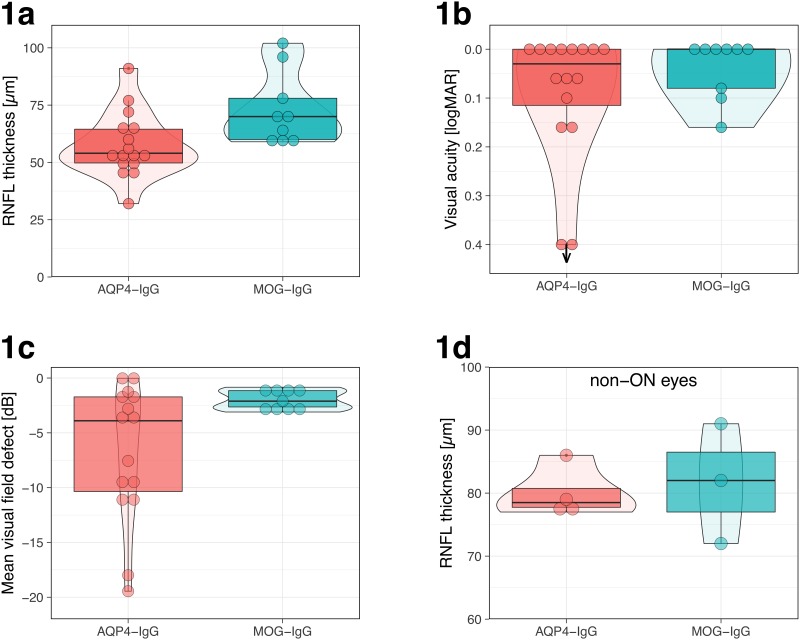
Fig 1. The distribution of average retinal nerve fiber layer (RNFL) thickness (1a), final visual acuity (1b) and final mean visual field defect (1c) in ON affected eyes of 16 patients following 43 optic neuritis episodes.
1d: The distribution of average retinal nerve fiber layer (RNFL) thickness in eyes unaffected by ON. 1b: note inverted logMAR scale: better acuity at top. The bottom two points at 0.3 logMAR with the downward arrow represent two eyes that were effectively blind. Left boxplots: Eyes of AQP4 IgG-positive patients. Right boxplots: Eyes of MOG IgG-positive patients. VA = final visual acuity. VF = mean automated Humphrey visual field defect. Box plot details: thick horizontal bar: median. Box: interquartile range (25%–75%). Whiskers: range. Dots: outliers (data >1.5 times the interquartile range off the box). The “violin plots” in the background visualize a smoothened density estimate.

