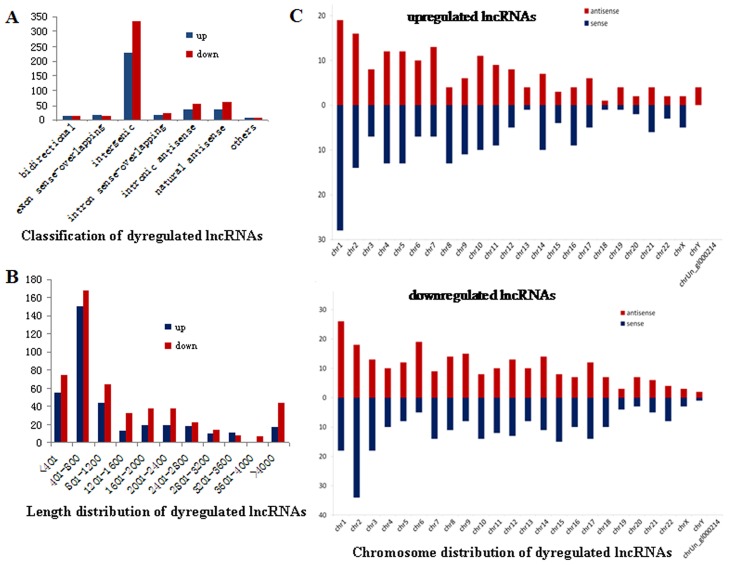
Fig 2. Expression signatures of deregulated lncRNAs in ATB group versus control group.
(A) Classification of lncRNAs. They were mainly intergenic. (B) Length distribution of lncRNAs. They were mainly between 401 and 800 nt in length. (C) Chromosome distribution of lncRNAs. Chromosome 1 and 2 were the most frequent ones and numbers of the deregulated lncRNAs on the two chromosomes accounted for approximately 11% and 9% of total deregulated ones, which were higher than the expected numbers based on chromosome total lncRNA numbers, respectively.

