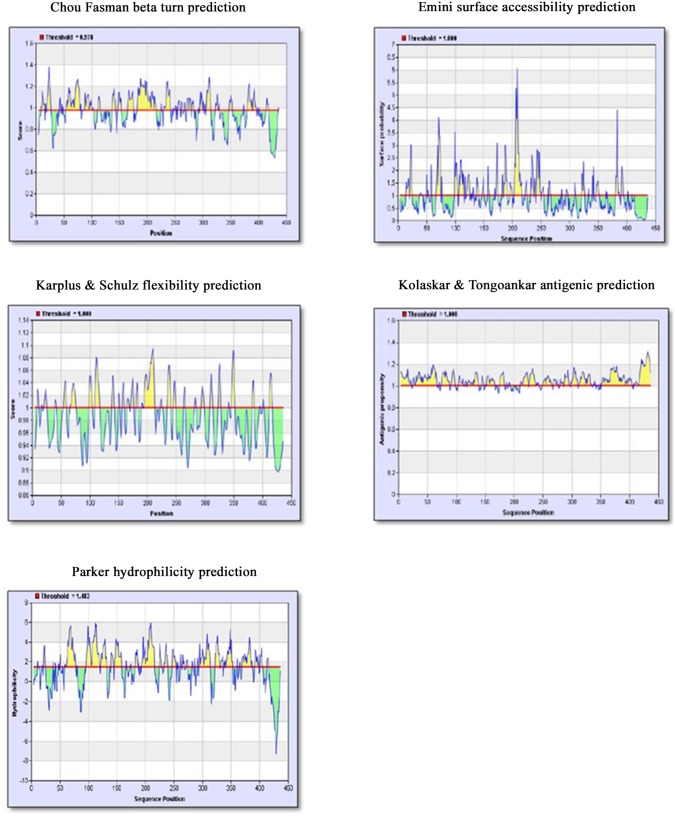
Fig 1. Results of five algorithms used in IEDB server to predict the immunodominant regions of CHIKV E1 glycoprotein.
X-axis represents the position of amino acids of the E1 glycoprotein and Y-axis depicts the score for each algorithm. The red line indicates the threshold used by the algorithm to screen the low scored regions. The yellow peaks represent the stretch of amino acids that have the ability to satisfy the criteria being studied in the respective algorithm.

