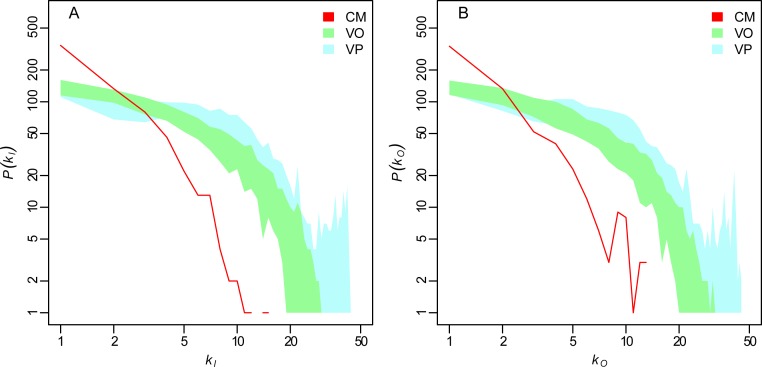
Fig 2. Farm degree distributions.
Farm degree distributions (in a log-log scale) of: cattle movement (CM) network (observed, red line); veterinary officer network (VO, 50 simulations, green shade); veterinary practitioner network (VP, 50 simulations, blue shade). Panels a) and b) correspond to kI (in-degree) and kO (out-degree), respectively.

