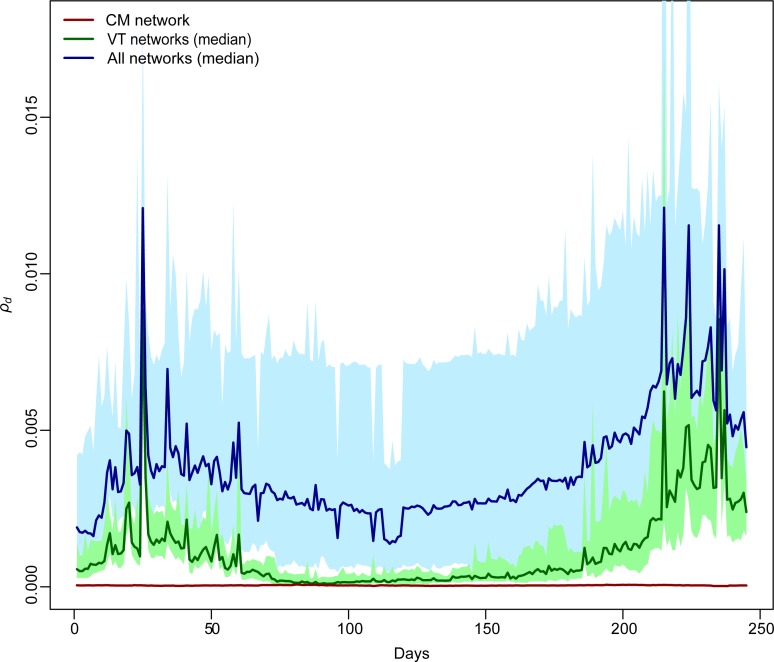
Fig 6. Transmission routes infection potential.
Daily system infection potential ρ(d) for cattle movement (CM) network (red line), the veterinarians total (VT) network (green shade results for 50 simulations, median case dark green line), and all networks combined (TN, blue shade results for 50 simulations, median case dark blue line).

