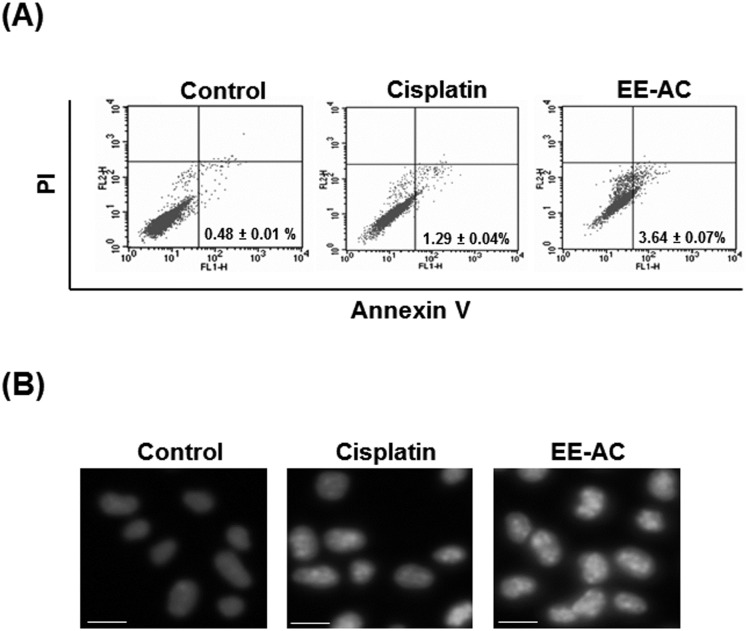
Fig 6. Effects of EE-AC on the induction of apoptosis in B16-F0 cells.
(A) Cells were treated with 0.1% DMSO (negative control) or IC50 values of cisplatin (10 μM) or EE-AC (50 μg/mL) for 48 h and then stained with annexin V-FITC and PI. The annexin V-FITC signal is shown on the X axis; the PI signal is shown on the Y axis. A representative dot plot of the FACScan profile shows the percentage of early apoptotic cells in the right-bottom panel of each plot. (B) Cells were treated with 0.1% DMSO (negative control) or cisplatin (10 μM), or EE-AC (50 μg/mL) for 48 h. Nuclear morphology was examined with an inverted fluorescence microscope. Arrows indicate condensed or fragmented nuclei. Scale bars represent 10 μm.

