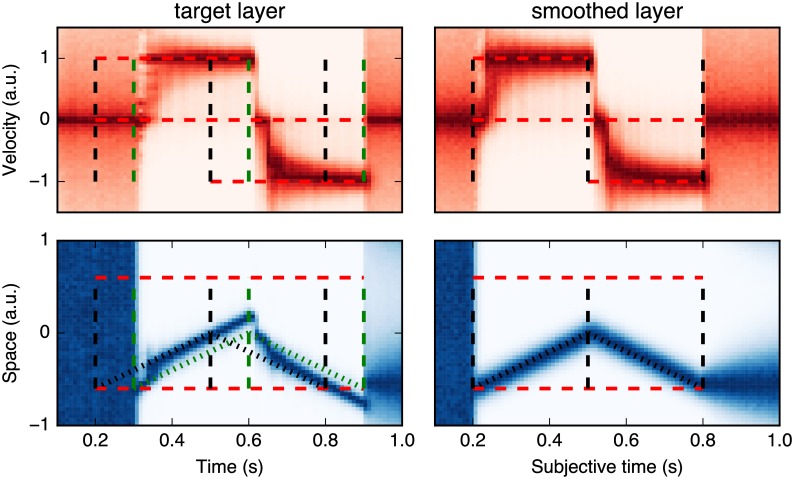
Fig 6. Estimating the dot position from the dMBP model during the motion reversal experiment.
In the motion reversal experiment, the moving dot reverses its direction at the middle of the trajectory (i.e., at t = 500 ms, as indicated by the mid-point vertical dashed line). In the left column (target layer) and as in Fig 5, we show the histogram of inferred positions during the dot motion and a trace of its position with the highest probability as a function of time. As expected, results are identical to Fig 5 in the first half period. At the moment of the motion reversal, the model output is consistent with previous psychophysical reports. First, the estimated position follows the extrapolated trajectory until the (delayed) sensory information about the motion reversal reaches the system (at t = 600 ms, green vertical dashed line). Then, the velocity is quickly reset and converges to the new (reversed) motion such that the estimated position “jumps” to a position corresponding to the updated velocity. In the right column (smoothed layer), we show the results of the same data after a smoothing operation of τs = 100 ms in subjective time. This different read-out from the inferred positions corresponds to the behavioral results obtained in some experiments, such as that from Whitney and Murakami [23].

