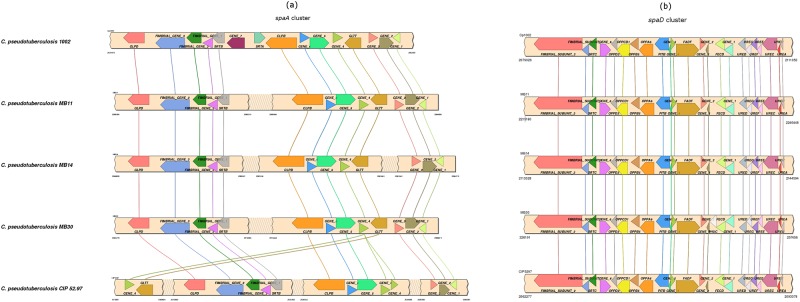
Fig 2. Synteny analysis of C. pseudotuberculosis pili gene clusters.
From top to the bottom of the figure the genome of strains 1002, MB11, MB14, MB30 and CIP 52.97 are shown. Genes are represented by arrows of different color. Genes without standardized names are identified as gene_1, gene_2, and so on. Conserved genes are connected by lines. (a) spaA cluster. (b) spaD cluster.

