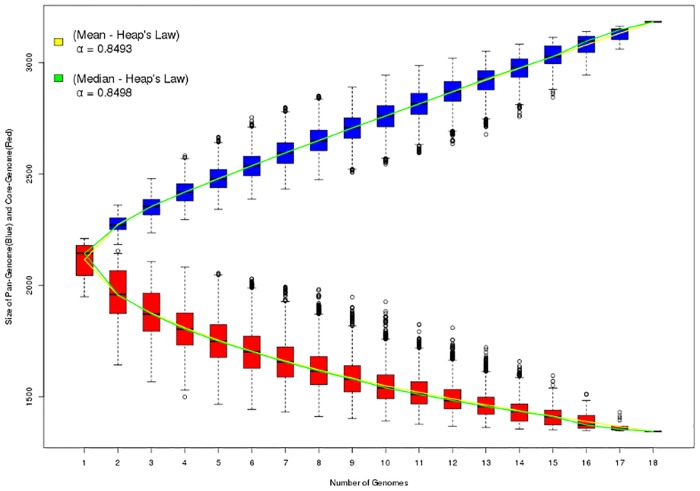
Fig 5. Prediction of the core genome and pangenome of eighteen genomes of C. pseudotuberculosis biovar equi.
The graphic bars represent the number of core genes (red bars) and pangenome (blue bars) for n combinations of the analyzed genomes. The dotted lines indicate the standard deviation of these combinations and white circles outside the dotted lines indicate discordant values of the analysis. The calculation of the pangenome and core genome size showed very similar values using either the mean (yellow line) or median (green line) of the possible combinations.

