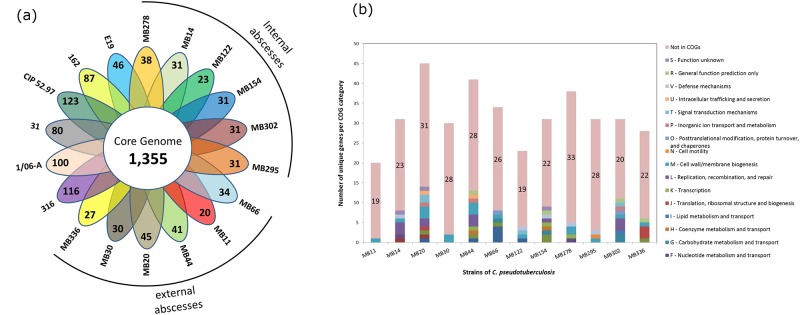
Fig 6. Graphical representations of the pangenome characteristics of biovar equi.
(a) Flower graph representing the number of core and accessory genes for each strain of biovar equi. The strains are listed by their names along with each set of singletons. Those strains causing internal or external abscesses are indicated by black lines. (b) Bar graph of singletons classified in COG categories. The numbers in the bars indicate the amount of genes not classified in COGs.

