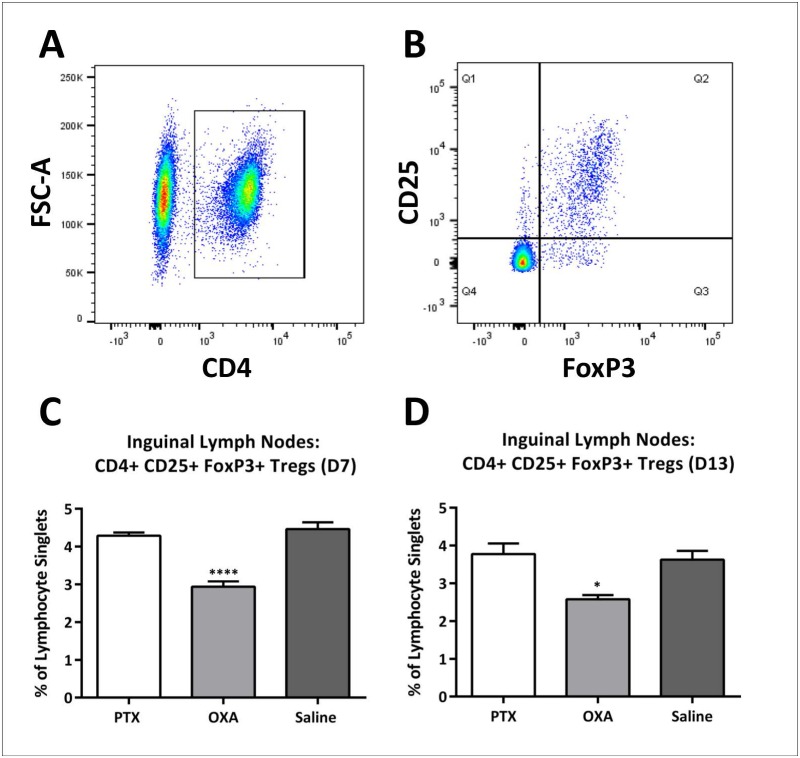
Fig 3. Changes in regulatory T-cell population in inguinal lymph nodes following chemotherapy.
Flow cytometry of lymphocytes to characterise regulatory T-(T-reg)-cell changes in inguinal lymph nodes on days 7 and 13 post-1st injection of paclitaxel (PTX), oxaliplatin (OXA) or saline (control) was carried out. CD4+ cells were first gated from lymphocyte singlets (A), followed by consecutive gating of CD25+FoxP3+ cells (B). Column graphs of CD4+CD25+FoxP3+ T-reg cell populations in the lymph nodes on day 7 (C) and day 13 (D) are expressed as a percentage of lymphocyte singlets. A significant decrease in T-reg cells was seen in OXA-treated mice on both day 7 (n = 6, ****P<0.0001) and day 13 (n = 4, *P<0.05) compared to saline control mice. One-way ANOVA followed by Bonferroni's multiple comparison’s test. Data are expressed as mean±SEM.

