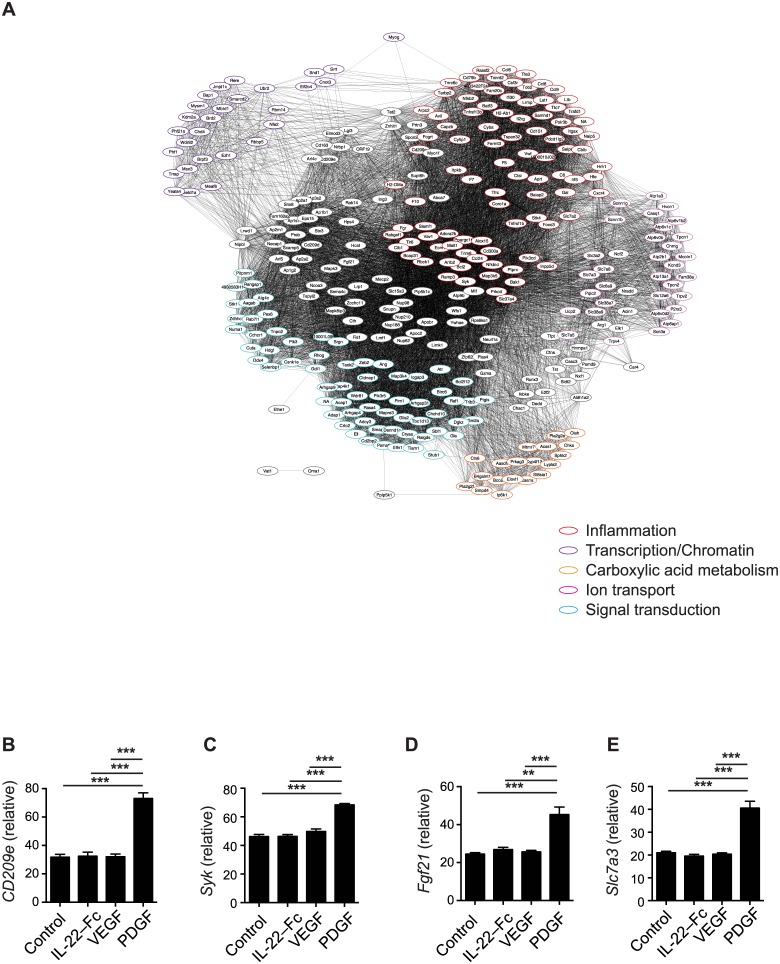
Fig 6. Genes up-regulated by PDGF in microarray analysis as in Fig 4.
(A) GO enrichment analysis of PDGF-specific gene expression. Clusters of genes in the network diagram were manually functionally annotated according to the primary biological role played by genes in the cluster. (B-E) gene expression of individual genes. (B) CD209e, (C) Syk, (D) Fgf21, (E) Slc7a3. Error bars, s.e.m. ** P < 0.01, *** P < 0.001. Unpaired Student’s t-test (B-E).

