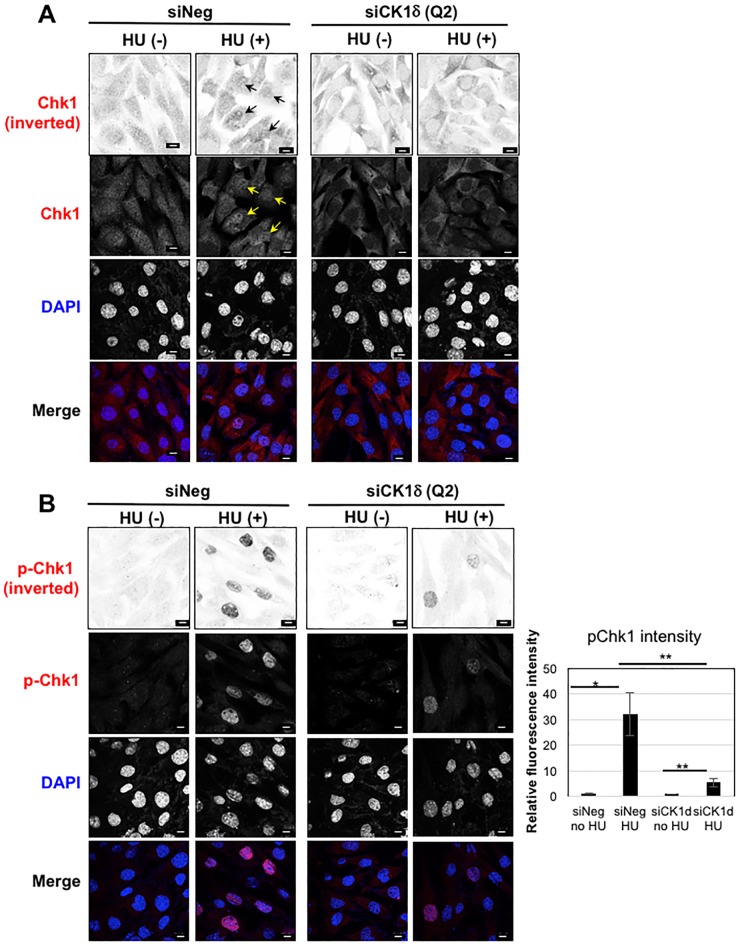
Fig 7. Nuclear distribution of Chk1 and p-Chk1 in MEFCtl. cells is inhibited by siRNA knockdown of CK1δ.
Cellular distribution of (A) Chk1 and (B) phosphorylated Chk1. MEFCtl. cells were transfected with negative control (siNeg) or CK1δ siRNA (siCK1δ), and 70 h later culture fluid was removed and fresh medium added with or without hydroxyurea (HU, 2mM final concentration) for 2 h incubation. Arrows indicate accumulation of Chk1 in the nucleus. Bars, 10 μm. Histogram shows statistical analysis of p-Chk1 intensity in the nucleus. Data is shown as mean +/- SD. p-Chk1 intensity was analyzed in 36 cells (siNeg—HU), 50 cells (siNeg + HU), 35 cells (siCK1δ - HU) and 30 cells (siCK1δ + HU). *p<0.05, **p<0.01. Knockdown of CK1δ in this experiment was confirmed by western blotting (data not shown).

