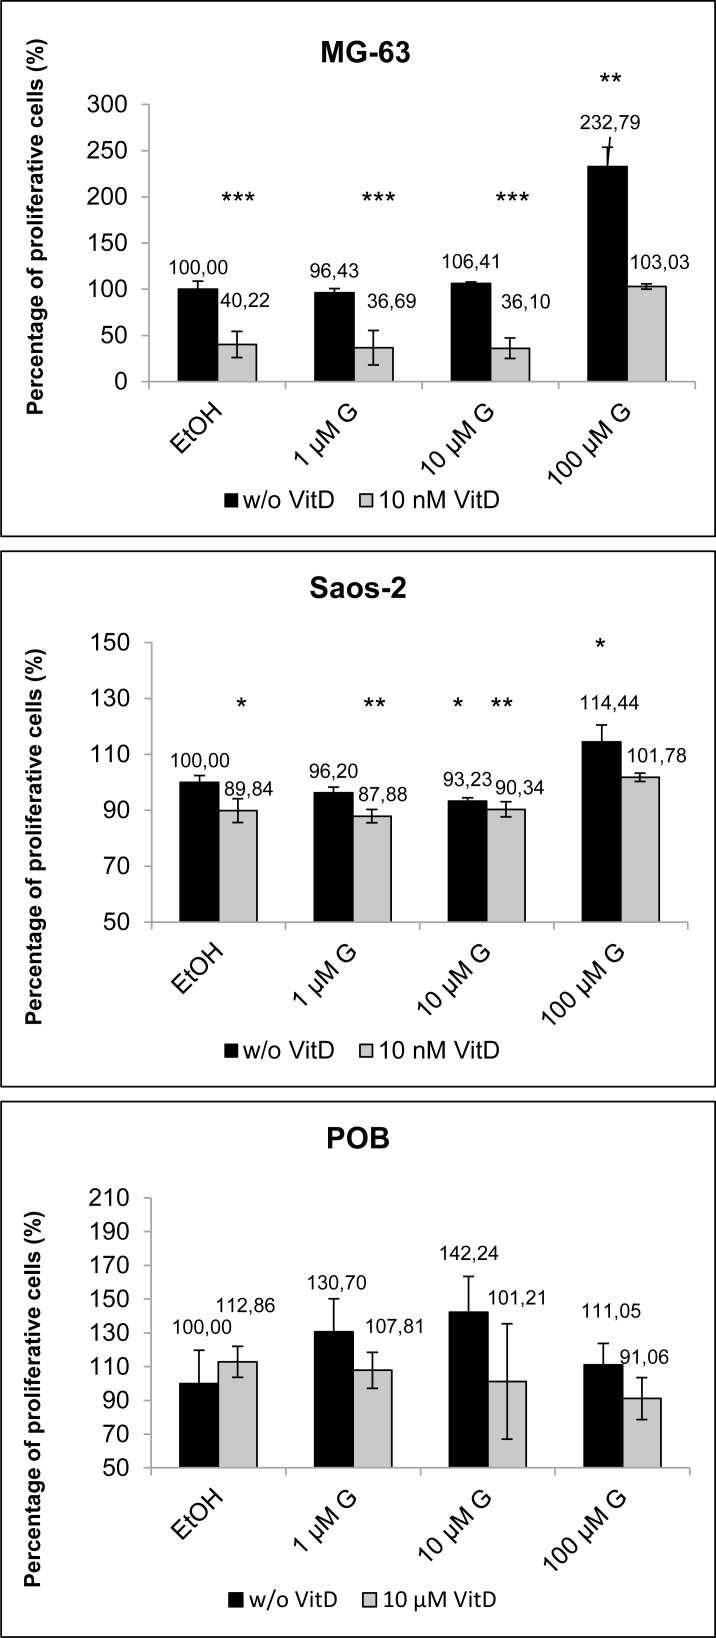
Fig 1. Cell cycle analysis of MG-63, Saos-2 bone cancer cells in comparison with primary osteoblasts (POB) after 48 h treatment with genistein (G; 1, 10, 100 μM; black bars) or in combination with 10 nM calcitriol (VitD; grey bars).
Given is the percentage of proliferative cells (G2/M + S phase) whereby the control was set to 100%. Note that 100 μM genistein induces a strong proliferation induction in MG-63 cells which could be normalized to control levels by the addition of 10 nM calcitriol. Mean ± SD, n = 5, ***P < 0.001, **P < 0.01, *P < 0.5, significantly different compared to control, unpaired t-test.

