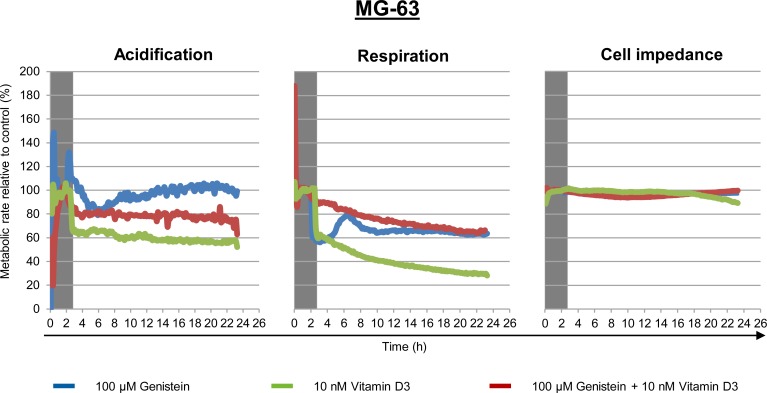
Fig 3. Live cell monitoring of three metabolic parameters (extracellular acidification, mitochondrial respiration, and cell impedance) in MG-63 after exposure to the vehicle control (was set to 100%), 100 μM genistein (blue lines), 10 nM calcitriol (red lines) or the combination of both (green lines) over 24 h.
Prior treatment cells were adapted to the flow conditions for at least 2 h (grey shadowed). n = 3.

