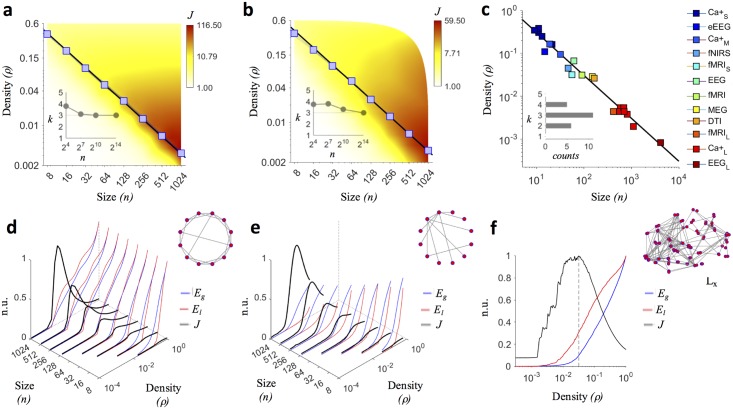
Fig 1. Density threshold in synthetic networks and in brain networks.
(a–b) Blue curves show the trends of the connection density threshold ρ for one-hundred generated small-world pws = 0.1 and scale-free mba = 9 networks along different sizes n. Blue squares spot out the average ρ values returned by the maximization of J. The black line shows the fit ρ = c/(n − 1) to the data, with c = 3.258 for small-world networks and c = 3.215 for scale-free networks (S1 Table). The background color codes for the average value of the quality function J. Insets indicate that the optimal average node degree, corresponding to the density that maximizes J, converges to k = 3 for large network sizes (n = 16834). (c) Optimal density values maximizing group-averaged J profiles for different brain networks. Imaging connectomes come from previously published studies (Table 1). The fit ρ = c/(n − 1) to the pooled data gives c = 3.06 (adjusted R2 = 0.994). The inset shows a sharp distribution for the corresponding average node degree, with a mode k = 3. (d–e) Average J profile (black curves) for simulated small-world and scale-free networks as a function of the network size (n) and of the density (ρ). J values are represented in normalized units (n.u.), having scaled them by the global maximum obtained for n = 1024. Blue and red curves show respectively the profiles of global- (Eg) and local-efficiency (El). (f) Group-averaged J profile for fMRI connectomes (Table 1). The grey dashed line indicates the actual density maximizing J, i.e., ρ = 0.035, corresponding to an average node degree k = 3.115. The graph illustrates the brain network of a representative healthy subject (lateral view, frontal lobe on the left Lx).

