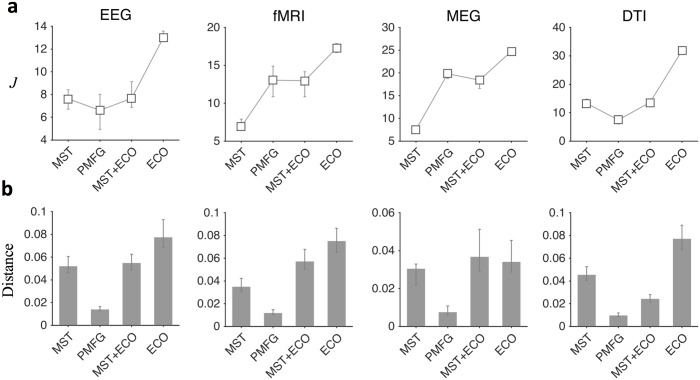
Fig 5. Statistical comparison of J values and distances across different thresholding methods.
Panel a) White squares show the medians of the J values of all the subjects in the two groups. Vertical bars denote the 5th and 95th percentiles. Panel b) Grey bars show the medians of the distances between samples (individuals) of different brain states. Vertical bars denote lower and upper quartiles. The choice of the filtering method significantly affects the J values and the respective distances between samples (Kruskalwallis tests, P < 0.01 for both J values and related distances, S3 Table). Overall, ECO gives significantly larger values as compared to the other methods (Tukey-Kramer post hoc tests, P < 0.05); in some isolated cases no significant improvements are reported (S4 Table).

