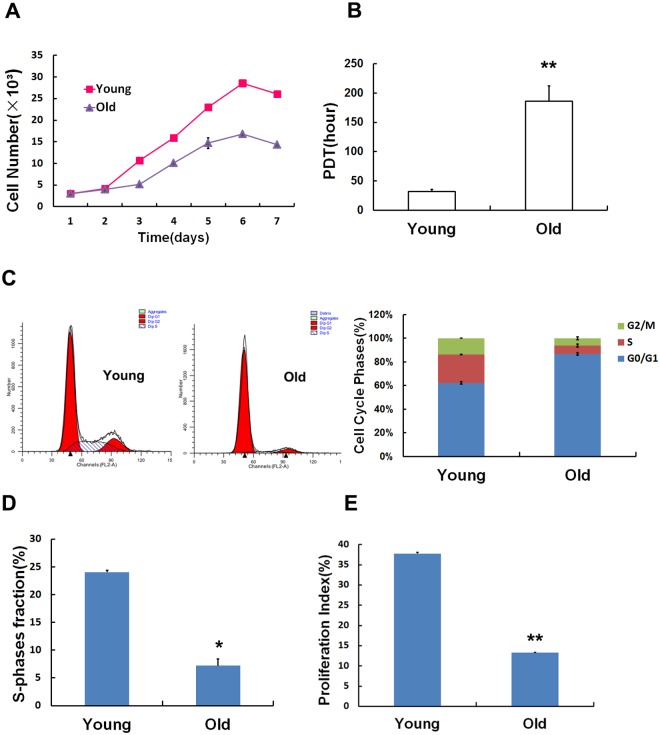
Fig 2. Age-induced variations in biological characteristics.
Cell growth curves and population doubling times were used to detect changes in proliferation in both groups. In the MSCs obtained from the old rats, growth slowed (A), and population doubling times were extended (B). The cell cycle was analyzed using flow cytometry. Most of the MSCs in the old group were arrested in G0/G1 phase at the expense of S phase (C). The S-phase fraction (D) and proliferation index (E) were lower in the old group than in the young group. Values indicate the mean ± SD (*p< 0.05, **p< 0.01).

