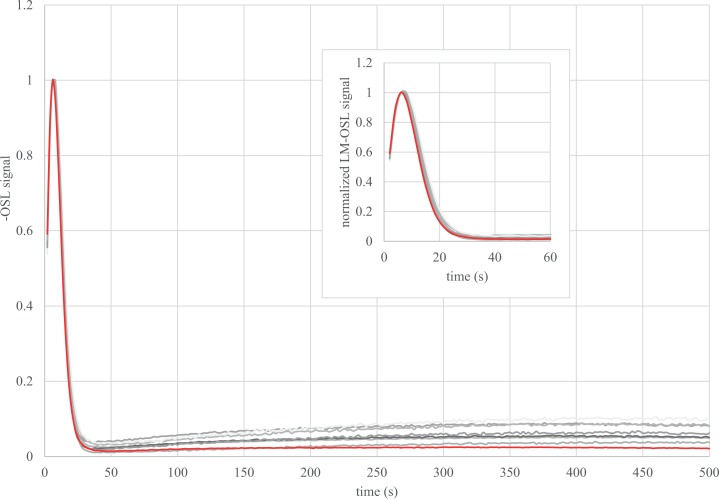
Fig 12. LM-OSL curves.
For each sample a regenerative dose was given to a multi-grain aliquot. After a 260°C for 10 s preheat, the intensity of the blue LED was increased linearly from 0 to 50 mW/cm2 for 500 s. The curves are compared to the LM-OSL glow curve of the Risoe calibration quartz (in red), which is known to be dominated by a fast component.

